Quantcast
Channel: Severalnines - MySQL
Viewing all 31 articles
Browse latest View live

ClusterControl on Docker

$
0
0

Today, we’re excited to announce our first step towards dockerizing our products. Please welcome the official ClusterControl Docker image, available on Docker Registry Hub. This will allow you to evaluate ClusterControl with a couple of commands:

$ docker pull severalnines/clustercontrol

The Docker image comes with ClusterControl installed and configured with all of its components, so you can immediately use it to manage and monitor your existing databases. Supported database servers/clusters:

  • Galera Cluster for MySQL
  • Percona XtraDB Cluster
  • MariaDB Galera Cluster
  • MySQL replication
  • MySQL single instance
  • MongoDB/TokuMX Replica Set
  • PostgreSQL single instance

As more and more people will know, Docker is based on the concept of so called application containers and is much faster or lightweight than full stack virtual machines such as VMWare or VirtualBox. It's a very nice way to isolate applications and services to run in a completely isolated environment, which a user can launch and tear down within seconds.

Having a Docker image for ClusterControl at the moment is convenient in terms of how quickly it is to get it up and running and it's 100% reproducible. Docker users can now start testing ClusterControl, since we have images that everyone can pull down and then launch the tool.

It is a start and our plan is to add better integration with the Docker API in future releases in order to transparently manage Docker containers/images within ClusterControl, e.g., to launch/manage and deploy database clusters using Docker images.

ClusterControl Docker Images

Please refer to the Docker Hub page for the latest instructions. Pick the operating system distribution images that you would like to deploy, and use the docker pull command to download the image. To pull all images:

$ docker pull severalnines/clustercontrol

You can pull the ClusterControl image that you want based on your target cluster’s operating system.

$ docker pull severalnines/clustercontrol:<ubuntu-trusty|debian-wheezy|redhat6|redhat7>

So, if you want to pull the ClusterControl image for CentOS 6/Redhat 6, just run:

$ docker pull severalnines/clustercontrol:redhat6 #or
$ docker pull severalnines/clustercontrol:centos6

** Image tagged with ‘centos6’ or ‘centos7’ aliases to redhat’s respectively.

Use the following command to run:

$ docker run -d --name clustercontrol -p 5000:80 severalnines/clustercontrol:redhat7

Once started, ClusterControl is accessible at http://<host IP address>:5000/clustercontrol. You should see the welcome page to create a default admin user. Use your email address and specify passwords for that user. By default MySQL users root and cmon will be using ‘password’ and ‘cmon’ as default password respectively. You can override this value with -e flag, as example below:

$ docker run -d --name clustercontrol -e CMON_PASSWORD=MyCM0n22 -e MYSQL_ROOT_PASSWORD=SuP3rMan -p 5000:80 severalnines/clustercontrol:debian

Optionally, you can map the HTTPS port using -p by appending the forwarding as below:

$ docker run -d --name clustercontrol -p 5000:80 -p 5443:443 severalnines/clustercontrol:redhat7

Verify the container is running by using the ps command:

$ docker ps

The Dockerfiles are available from our Github repository. You can build it manually by cloning the repository:

$ git clone https://github.com/severalnines/docker 
$ cd docker/[operating system] 
$ docker build -t severalnines/clustercontrol:[operating system] .

** Replace [operating system] with your choice of OS distribution; redhat6, redhat7, centos6, centos7, debian-wheezy, ubuntu-trusty.


Example Deployment

We have a physical host, 192.168.50.130 installed with Docker. We are going to create a three-node Galera cluster running on Percona XtraDB Cluster and then import it into ClusterControl, which is running in another container. This example deployment uses CentOS/Redhat based images. Following is the high-level architecture diagram:

Installing Docker

In this example, we are going to install Docker on CentOS 7, using virt-7 repository.  Create the repository file:

$ vim /etc/yum.repos.d/virt-7-testing.repo

Add the following lines:

[virt7-testing]
name=virt7-testing
baseurl=http://cbs.centos.org/repos/virt7-testing/x86_64/os/
enabled=1
gpgcheck=0

Install Docker:

$ yum install -y docker

Start and enable the Docker daemon:

$ systemctl start docker
$ systemctl enable docker

Disable firewalld to avoid conflicts with Docker’s iptables rules:

$ systemctl disable firewalld
$ systemctl stop firewalld


Deploying Percona XtraDB Cluster

We are going to use a Dockerfile to build and deploy a three-node Galera / Percona XtraDB Cluster:

$ git clone https://github.com/alyu/docker
$ cd docker/percona-xtradb-5.6/centos/
$ ./build.sh
$ ./start-servers.sh 3
$ ./bootstrap-cluster.sh

** Enter root123 as the root password if prompted.

Verify the containers are up:

$ docker ps | grep galera
aedd64fa373b        root/centos:pxc56                    "/bin/bash /opt/init   7 minutes ago        Up 7 minutes        22/tcp, 80/tcp, 443/tcp, 3306/tcp, 4444/tcp, 4567-4568/tcp             galera-3
c5fc95f9912e        root/centos:pxc56                    "/bin/bash /opt/init   7 minutes ago        Up 7 minutes        22/tcp, 80/tcp, 443/tcp, 3306/tcp, 4444/tcp, 4567-4568/tcp             galera-2
7df4814686a0        root/centos:pxc56                    "/bin/bash /opt/init   7 minutes ago        Up 7 minutes        22/tcp, 80/tcp, 443/tcp, 3306/tcp, 4444/tcp, 4567-4568/tcp             galera-1


Deploying ClusterControl

Since our Galera Cluster is deployed and running on Centos 7, we need to use the CentOS/Redhat base image for ClusterControl. Simply run the following command to pull the image:

$ docker pull severalnines/clustercontrol:centos7

Start the container as daemon and forward port 80 on the container to port 5000 on the host:

$ docker run -d --name clustercontrol -p 5000:80 severalnines/clustercontrol:centos7

Verify the ClusterControl container is up:

$ docker ps | grep clustercontrol
59134c17fe5a        severalnines/clustercontrol:centos7   "/entrypoint.sh"       2 minutes ago       Up 2 minutes        22/tcp, 3306/tcp, 9500/tcp, 9600/tcp, 9999/tcp, 0.0.0.0:5000->80/tcp   clustercontrol

Open a browser, go to http://192.168.50.130:5000/clustercontrol and create a default admin user and password. You should see the ClusterControl landing page similar to below:

You now have ClusterControl and a Galera cluster running on 4 Docker containers. 


Adding your Existing Cluster

After the database cluster is running, you can add it into ClusterControl by setting up the passwordless SSH to all managed nodes beforehand. To do this, run the following steps on ClusterControl node.

1. Enter the container console as root:

$ docker exec -it clustercontrol /bin/bash

2. Copy the SSH key to all managed database nodes:

$ ssh-copy-id 172.17.0.2
$ ssh-copy-id 172.17.0.3
$ ssh-copy-id 172.17.0.4

** The Docker images that we used has root123 setup as root password. Depending on your chosen operating system, please ensure you have the root password configured for this to work, or you can skip it by adding your SSH key file manually into the managed hosts.

3. Start importing the cluster into ClusterControl. Open a web browser and go to Docker’s physical host IP address with the mapped port e.g, http://192.168.50.130:5000/clustercontrol and click Add Existing Cluster/Server and specify following information:

** You just need to enter ONE IP address of one of the Galera members. ClusterControl will auto discover the rest of the cluster members in the cluster and register them. Once added, you should see the Galera cluster is listed under Database Clusters list:

We are done. 


What happens if a container is restarted and gets a new IP?

Note that Docker container does not use static IP, unless you explicitly configure a custom bridge which is out of the scope of this blog. This could be problematic to ClusterControl since it relies on proper IP address configuration for database grants and passwordless SSH. If the ClusterControl container restarted:

On all nodes (including ClusterControl), run following statements as root@localhost:

mysql> UPDATE mysql.user SET host = '<new IP address>' WHERE host = '<old IP address>';
mysql> FLUSH PRIVILEGES;

You also need to manually change the IP address inside /etc/cmon.cnf and/or /etc/cmon.d/cmon_<cluster ID>.cnf:

$ sed -i 's|<old IP address>|<new IP address>|g' /etc/cmon.cnf
$ sed -i 's|<old IP address>|<new IP address>|g' /etc/cmon.d/cmon_1.cnf # if exists
$ sed -i 's|<old IP address>|<new IP address>|g' /etc/cmon.d/cmon_2.cnf # if exists

** Replace <old IP address> and <new IP address> with their respective values.

Restart the cmon process to apply the changes:

$ service cmon restart

That’s it folks. The above ClusterControl + Galera Cluster setup took about 15 minutes to deploy in a container environment. How long did it take you? :-) 

Blog category:


Latest Severalnines Resources: New Galera Cluster Training, New ClusterControl Docker Image, Monitoring Galera and more!

$
0
0

Check Out Our Latest Technical Resources for MySQL, MariaDB, Postgres and MongoDB.

This blog is packed with all the latest resources and tools we’ve recently published! Please do check it out and let us know if you have any comments or feedback.


Product Announcements & Resources

New 1-Day Instructor-led Online Training Course:

Automation & Management of Galera Clusters for MySQL, MariaDB & Percona XtraDB

  • When: The first training course will take place on June 12th 2015 - European time zone
  • Where: In a virtual classroom as well as a virtual lab for hands-on lab exercises
  • How: Reserve your seat online and we will contact you back with all the relevant details

You will learn about:

  • Galera Cluster, system architecture & multi-data centre setups
  • Automated deployment & node / cluster recovery
  • How to best migrate data into Galera Cluster
  • Monitoring & troubleshooting basics
  • Load balancing and cluster management techniques

Sign up now!


New ClusterControl Docker Image

For those of you interested in and working with Docker, you can now instantly manage and monitor an existing database infrastructure thanks to our new Docker image, which comes with ClusterControl installed and is configured with all of its relevant components.

Get the image


Technical Webinar - Replay

A Deep Dive Into How to Monitor Galera Cluster for MySQL & MariaDB

In this webinar, our colleague Krzysztof Książek, Senior Support Engineer, provided a deep-dive session on what to monitor in Galera Cluster for MySQL & MariaDB. Krzysztof is a MySQL DBA with experience in managing complex database environments for companies like Zendesk, Chegg, Pinterest and Flipboard. If you’re in Operations and your job is to monitor the health of MySQL/MariaDB Galera Cluster or Percona XtraDB Cluster, then this webinar replay is for you!

View the replay


Technical Blogs

Here is a listing of our most recent technical blogs. Do check them out and let us know if you have any questions.

As you will see, we had a bit of a focus on Galera in April ;-)

We trust these resources are useful. If you have any questions on them or on related topics, please do contact us!

Blog category:

5 Performance tips for running Galera Cluster for MySQL or MariaDB on AWS Cloud

$
0
0

Amazon Web Services is one of the most popular cloud environments. Galera Cluster is one of the most popular MySQL clustering solutions. This is exactly why you’ll see many Galera clusters running on EC2 instances. In this blog post, we’ll go over five performance tips that you need to take under consideration while deploying and running Galera Cluster on EC2. If you want to run regular MySQL on EC2, you’ll find these tips still useful because, well, Galera is built on top of MySQL after all. Hopefully, these tips will help you save time, money, and achieve better Galera/MySQL performance within AWS.

Choosing a good instance size

When you take a look at the instance chart in the AWS documentation, you’ll see that there are so many instances to choose from. Obviously, you will pick an instance depending on your application needs (therefore you have to do some benchmarking first to understand those needs), but there are couple of things to consider.

CPU and memory - rather obvious. More = better. You want to have some headroom in terms of free CPU, to handle any unexpected spikes of traffic - we’d aim for ~50% of CPU utilization max, leaving the rest of it free.

We are talking about virtualized environment thus we should mention CPU steal utilization. Virtualization offers the ability to over-subscribe the CPU between multiple instances because not all instances need CPU at the same time. Sometimes an instance cannot get the CPU cycles it wants. It can be caused by over allocation on the host’s side when there are no additional CPU cycles to share (you can prevent it from happening by using dedicated instances - “Dedicated Tenancy” can be chosen when you create new instance inside of VPC, additional charges apply) or it can also happen when the load on the instance is too high and the hypervisor throttled it down to its limits.

Network and I/O capacity - by default, on non-EBS-optimized instances, network is shared for regular traffic and EBS traffic. It means that your reads and writes will have to compete for the same resource with the replication traffic. You need to measure your network utilization to make sure it is within your instance’s capacity. You can give some free resources to EBS traffic by enabling ‘EBS-optimized’ flag for instance, but again, network capacity differs between instance types - you have to pick something which will handle your traffic.

If you have a large cluster and you feel brave, you can use ephemeral SSD storage on instances as a data directory - it will reduce expenses on pIOPS EBS volumes. On the other hand, instance crash will end in data being wiped out. Galera can recover from such state using SST, but you would have to have a large cluster spanning multiple AWS regions to even consider this setup as an option. Even in such a case, you may consider using at least one EBS-based node per region, to be able to survive crashes and have data locally for SST.

If you choose EBS as your storage, you have to remember that EBS should be warmed up before putting it into production. EBS allocates only those blocks which are actually used. If you didn’t write on a given block, it will have to be allocated once you do this. Allocation process adds overhead (per Amazon it may be up to 50% of the performance) so it is a very good practice to perform the warmup. It can be done in several ways.
If the volume is new, then you can run:

$ sudo umount /dev/xvdx
$ sudo dd if=/dev/zero of=/dev/xvdx bs=1M

If the volume was created from the snapshot of the warmed up volume, you need just to read all of the blocks by:

$ sudo umount /dev/xvdf
$ sudo dd if=/dev/xvdf of=/dev/null bs=1M

On the other hand, if the original volume has not been warmed up, then the new volume needs a thorough warming by reading each block and writing it back to the volume (no data will get lost in the process):

$ sudo umount /dev/xvdf
$ sudo dd if=/dev/xvdf of=/dev/xvdf conv=notrunc bs=1M


Choosing a deployment architecture

AWS gives you multiple options regarding the way your architecture may look like. We are not going into details of VPC vs. non-VPC, ELB’s or Route53 - it’s really up to you and your needs. What we’d like to discuss are availability zones and regions. In general, more spread cluster = better HA. The catch is that Galera is very latency-bound in terms of performance and long distances do not serve it well. While designing a DR site in a separate region, you need to make sure that your cluster design will still match the required performance.

Availability Zones are a different story - latency is fine here and AZ’s provide some level of protection against infrastructure outages (although it has happened that a whole AWS region went down). What you may want to consider is using Galera segments. Segments, in Galera terms, define groups of nodes that are close to each other in terms of network latency. Which may be the same as datacenters when you are deploying across a few sites. Nodes within a single segment will not talk to the rest of the cluster, with the exception of one single relay node (chosen automatically). Data transfers (both IST and SST) will also happen within nodes from the same segment (only if it is possible). This is somewhat important because of the network transfer fees that apply to connections between multiple AWS regions but also between different AZ’s - using segments you can significantly decrease the amount of data transferred between them.

With a single segment, writesets are sent from a host that received DML to all other nodes in the cluster:

As you can see, we have three copies of replication data sent from the datacenter A to the datacenter B. With segments it’s different. In datacenter B one of the hosts will be picked as a relay node and only this node will get the replication data. If that node fails, another one will be picked automatically.

As you can see, we just removed two thirds of the traffic between our two datacenters.


Operating system configuration

vm.swappiness = 1

Swappiness controls how aggressive the operating system will use swap. It should not be set to zero because in more recent kernels it prevents the OS from using swap at all and it may cause serious performance issues.

/sys/block/*/queue/scheduler = deadline/noop

Scheduler for the block device, which MySQL uses, should be set to either deadline or noop. Exact choice depends on the benchmarks but both settings should deliver similar performance, better than default scheduler, CFQ.

For MySQL, you should consider using EXT4 or XFS, depending on the kernel (performance of those filesystems changes from one kernel version to another). Perform some benchmarks to find the better option for you.


my.cnf configuration

wsrep_provider_options="evs.suspect_timeout=PT5S"
wsrep_provider_options="evs.inactive_timeout=PT15S"

You may want to consider changing the default values of these variables. Both timeouts govern how the cluster evicts failed nodes. Suspect timeout takes place when all of the nodes cannot reach the inactive member. Inactive timeout defines a hard limit of how long a node can stay in the cluster if it’s not responding. Usually you’ll find that the default values work well. But in some cases, especially if you run your Galera cluster over WAN (for example, between AWS regions), increasing those variables may result in more stable performance.

wsrep_provider_options="evs.send_window=4"
wsrep_provider_options="evs.user_send_window=2"

These variables, evs.send_window and evs.user_send_window define how many packets can be sent in the replication at a single time (evs.send_window) and how many of them may contain data (evs.user_send_window). The later should be no more than the half of the former. 
For high latency connections it may be worth increasing those values significantly (512 and 256 for example).

The following variable may also be changed. evs.inactive_check_period, by default, is set to one second, which may be too often for a WAN setup.

wsrep_provider_options="evs.inactive_check_period=PT1S"


Network tuning

Here comes the tricky part. Unfortunately, there is no definitive answer on how to set up both Galera and the OS’s network settings. As a rule of thumb, you may assume that in high latency environments, you would like to increase the amount of data sent at once. You may want to look into variables like gcs.max_packet_size and increase it. Additionally, you will probably want to push the replication traffic as quickly as possible, minimizing the breaks. Having gcs.fc_factor close to 1 and significantly larger than default gcs.fc_limit should help to achieve that.

Apart from Galera settings, you may want to play with the operating system’s TCP settings like net.core.rmem_max, net.core.wmem_max, net.core.rmem_default, net.core.wmem_default, net.ipv4.tcp_tw_reuse, net.ipv4.tcp_slow_start_after_idle, net.ipv4.tcp_max_syn_backlog, net.ipv4.tcp_rmem, net.ipv4.tcp_wmem. As mentioned earlier, it is virtually impossible to give you a simple recipe on how to set those knobs as it depends too many factors - you will have to do your own benchmarks, using data as close to your production data as possible, before you can say your system is tuned.

We will continue this topic in a follow-up blog - in the next part we are going to discuss how you can leverage AWS tools while maintaining your Galera cluster. 

Blog category:

Installing Kubernetes Cluster with 3 minions on CentOS 7 to manage pods and services

$
0
0

Kubernetes is a system for managing containerized applications in a clustered environment. It provides basic mechanisms for deployment, maintenance and scaling of applications on public, private or hybrid setups. It also comes with self-healing features where containers can be auto provisioned, restarted or even replicated. 

Kubernetes is still at an early stage, please expect design and API changes over the coming year. In this blog post, we’ll show you how to install a Kubernetes cluster with three minions on CentOS 7, with an example on how to manage pods and services. 


Kubernetes Components

Kubernetes works in server-client setup, where it has a master providing centralized control for a number of minions. We will be deploying a Kubernetes master with three minions, as illustrated in the diagram further below.

Kubernetes has several components:

  • etcd - A highly available key-value store for shared configuration and service discovery.
  • flannel - An etcd backed network fabric for containers.
  • kube-apiserver - Provides the API for Kubernetes orchestration.
  • kube-controller-manager - Enforces Kubernetes services.
  • kube-scheduler - Schedules containers on hosts.
  • kubelet - Processes a container manifest so the containers are launched according to how they are described.
  • kube-proxy - Provides network proxy services.


Deployment on CentOS 7

We will need 4 servers, running on CentOS 7.1 64 bit with minimal install. All components are available directly from the CentOS extras repository which is enabled by default. The following architecture diagram illustrates where the Kubernetes components should reside:

Prerequisites

1. Disable iptables on each node to avoid conflicts with Docker iptables rules:

$ systemctl stop firewalld
$ systemctl disable firewalld

2. Install NTP and make sure it is enabled and running:

$ yum -y install ntp
$ systemctl start ntpd
$ systemctl enable ntpd

Setting up the Kubernetes Master

The following steps should be performed on the master.

1. Install etcd and Kubernetes through yum:

$ yum -y install etcd kubernetes

2. Configure etcd to listen to all IP addresses inside /etc/etcd/etcd.conf. Ensure the following lines are uncommented, and assign the following values:

ETCD_NAME=default
ETCD_DATA_DIR="/var/lib/etcd/default.etcd"
ETCD_LISTEN_CLIENT_URLS="http://0.0.0.0:4001"

3. Configure Kubernetes API server inside /etc/kubernetes/apiserver. Ensure the following lines are uncommented, and assign the following values:

KUBE_API_ADDRESS="--address=0.0.0.0"
KUBE_API_PORT="--port=8080"
KUBELET_PORT="--kubelet_port=10250"
KUBE_ETCD_SERVERS="--etcd_servers=http://127.0.0.1:4001"
KUBE_SERVICE_ADDRESSES="--portal_net=10.254.0.0/16"
KUBE_ADMISSION_CONTROL="--admission_control=NamespaceAutoProvision,LimitRanger,ResourceQuota"
KUBE_API_ARGS=""

4. Configure the Kubernetes controller manager inside /etc/kubernetes/controller-manager. Define the minion machines’ IP addresses:

KUBELET_ADDRESSES="--machines=192.168.50.131,192.168.50.132,192.168.50.133"

5. Define flannel network configuration in etcd. This configuration will be pulled by flannel service on minions:

$ etcdctl mk /coreos.com/network/config '{"Network":"172.17.0.0/16"}'

6. Start and enable etcd, kube-apiserver, kube-controller-manager and kube-scheduler:

$ for SERVICES in etcd kube-apiserver kube-controller-manager kube-scheduler; do 
    systemctl restart $SERVICES
    systemctl enable $SERVICES
    systemctl status $SERVICES 
done

7. At this point, we should notice that all Minions’ statuses are still unknown because we haven’t started any of them yet:

$ kubectl get minions
NAME             LABELS        STATUS
192.168.50.131   Schedulable   <none>    Unknown
192.168.50.132   Schedulable   <none>    Unknown
192.168.50.133   Schedulable   <none>    Unknown

Setting up Kubernetes Minions

The following steps should be performed on minion1, minion2 and minion3 unless specified otherwise.

1. Install flannel and Kubernetes using yum:

$ yum -y install flannel kubernetes

2. Configure etcd server for flannel service. Update the following line inside /etc/sysconfig/flanneld to connect to the respective master:

FLANNEL_ETCD="http://192.168.50.130:4001"

3. Configure Kubernetes default config at /etc/kubernetes/config, ensure you update the KUBE_MASTER value to connect to the Kubernetes master API server:

KUBE_MASTER="--master=http://192.168.50.130:8080"

4. Configure kubelet service inside /etc/kubernetes/kubelet as below:
minion1:

KUBELET_ADDRESS="--address=0.0.0.0"
KUBELET_PORT="--port=10250"
# change the hostname to this host’s IP address
KUBELET_HOSTNAME="--hostname_override=192.168.50.131"
KUBELET_API_SERVER="--api_servers=http://192.168.50.130:8080"
KUBELET_ARGS=""

minion2:

KUBELET_ADDRESS="--address=0.0.0.0"
KUBELET_PORT="--port=10250"
# change the hostname to this host’s IP address
KUBELET_HOSTNAME="--hostname_override=192.168.50.132"
KUBELET_API_SERVER="--api_servers=http://192.168.50.130:8080"
KUBELET_ARGS=""

minion3:

KUBELET_ADDRESS="--address=0.0.0.0"
KUBELET_PORT="--port=10250"
# change the hostname to this host’s IP address
KUBELET_HOSTNAME="--hostname_override=192.168.50.133"
KUBELET_API_SERVER="--api_servers=http://192.168.50.130:8080"
KUBELET_ARGS=""

5. Start and enable kube-proxy, kubelet, docker and flanneld services:

$ for SERVICES in kube-proxy kubelet docker flanneld; do 
    systemctl restart $SERVICES
    systemctl enable $SERVICES
    systemctl status $SERVICES 
done

6. On each minion, you should notice that you will have two new interfaces added, docker0 and flannel0. You should get different range of IP addresses on flannel0 interface on each minion, similar to below:
minion1:

$ ip a | grep flannel | grep inet
inet 172.17.45.0/16 scope global flannel0

minion2:

$ ip a | grep flannel | grep inet
inet 172.17.38.0/16 scope global flannel0

minion3:

$ ip a | grep flannel | grep inet
inet 172.17.93.0/16 scope global flannel0

6. Now login to Kubernetes master node and verify the minions’ status:

$ kubectl get minions
NAME             LABELS        STATUS
192.168.50.131   Schedulable   <none>    Ready
192.168.50.132   Schedulable   <none>    Ready
192.168.50.133   Schedulable   <none>    Ready

You are now set. The Kubernetes cluster is now configured and running. We can start to play around with pods.


Creating Pods (Containers)

To create a pod, we need to define a yaml file in the Kubernetes master, and use the kubectl command to create it based on the definition. Create a mysql.yaml file: 

$ mkdir pods
$ cd pods
$ vim mysql.yaml

And add the following lines:

apiVersion: v1beta3
kind: Pod
metadata:
  name: mysql
  labels:
    name: mysql
spec:
  containers:
    - resources:
        limits :
          cpu: 1
      image: mysql
      name: mysql
      env:
        - name: MYSQL_ROOT_PASSWORD
          # change this
          value: yourpassword
      ports:
        - containerPort: 3306
          name: mysql

Create the pod:

$ kubectl create -f mysql.yaml

It may take a short period before the new pod reaches the Running state. Verify the pod is created and running:

$ kubectl get pods
POD       IP            CONTAINER(S)   IMAGE(S)   HOST                            LABELS       STATUS    CREATED
mysql     172.17.38.2   mysql          mysql      192.168.50.132/192.168.50.132   name=mysql   Running   3 hours

So, Kubernetes just created a Docker container on 192.168.50.132. We now need to create a Service that lets other pods access the mysql database on a known port and host.


Creating Service

At this point, we have a MySQL pod inside 192.168.50.132. Define a mysql-service.yaml as below:

apiVersion: v1beta3
kind: Service
metadata:
  labels:
    name: mysql
  name: mysql
spec:
  publicIPs:
    - 192.168.50.132
  ports:
    # the port that this service should serve on
    - port: 3306
  # label keys and values that must match in order to receive traffic for this service
  selector:
    name: mysql

Start the service:

$ kubectl create -f mysql-service.yaml

You should get a 10.254.x.x IP range assigned to the mysql service. This is the Kubernetes internal IP address defined in /etc/kubernetes/apiserver. This IP is not routable outside, so we defined the public IP instead (the interface that connected to external network for that minion):

$ kubectl get services
NAME            LABELS                                    SELECTOR     IP               PORT(S)
kubernetes      component=apiserver,provider=kubernetes   <none>       10.254.0.2       443/TCP
kubernetes-ro   component=apiserver,provider=kubernetes   <none>       10.254.0.1       80/TCP
mysql           name=mysql                                name=mysql   10.254.13.156    3306/TCP
                                                                       192.168.50.132

Let’s connect to our database server from outside (we used MariaDB client on CentOS 7):

$ mysql -uroot -p -h192.168.50.132
Welcome to the MariaDB monitor.  Commands end with ; or \g.
Your MySQL connection id is 4
Server version: 5.6.24 MySQL Community Server (GPL)

Copyright (c) 2000, 2014, Oracle, MariaDB Corporation Ab and others.

Type 'help;' or '\h' for help. Type '\c' to clear the current input statement.

MySQL [(none)]> show variables like '%version%';
+-------------------------+------------------------------+
| Variable_name           | Value                        |
+-------------------------+------------------------------+
| innodb_version          | 5.6.24                       |
| protocol_version        | 10                           |
| slave_type_conversions  |                              |
| version                 | 5.6.24                       |
| version_comment         | MySQL Community Server (GPL) |
| version_compile_machine | x86_64                       |
| version_compile_os      | Linux                        |
+-------------------------+------------------------------+
7 rows in set (0.01 sec)

That’s it! You should now be able to connect to the MySQL container that resides on minion2. 

Check out the Kubernetes guestbook example on how to build a simple, multi-tier web application with Redis in master-slave setup. In a follow-up blog post, we are going to play around with Galera cluster containers on Kubernetes. Stay tuned!


References

Blog category:

Leveraging AWS tools to speed up management of Galera Cluster on Amazon Cloud

$
0
0

We previously covered basic tuning and configuration best practices for MyQL Galera Cluster on AWS. In this blog post, we’ll go over some AWS features/tools that you may find useful when managing Galera on Amazon Cloud. This won’t be a detailed how-to guide as each tool described below would warrant its own blog post. But this should be a good overview of how you can use the AWS tools at your disposal.

EBS backups

If you have chosen EBS volumes as storage for your database (you could have chosen ephemeral volumes too), you can benefit greatly from their ability of taking snapshots of the data.

In general, there are two ways of running backups:

  • Logical backup executed in the form of mysqldump, mydumper or similar tools. The result of it is a set of SQL commands which should recreate your database;
  • Physical backup created, very often, using xtrabackup. 

Xtrabackup is a great tool but it is limited by network performance. If you create a streaming backup, you need to push data over the network. If you have local backups but you want to provision a new host, you have to push the data over the network.

EBS volumes, on the other hand, allow you to take snapshots. Such snapshot can be then used to create a new EBS volume, which can be mounted to an existing instance or a new one. It limits the overhead of managing backups - no need to move them from one place to another, the snapshots are just there, when you need them.

There are couple of things you’d want to consider before relying on EBS snapshots as a backup solution. First - it is a snapshot. The snapshot is taken at a given time for a given volume. If MySQL is up, when it comes to data integrity, the snapshot data is somewhat equivalent to that of a forced power-off. If you’d like to restore a database from the snapshot, you should expect to perform InnoDB recovery - a process which may take a while to complete. You may minimize this impact by either running ‘FLUSH TABLES WITH READ LOCK’ as a part of the snapshotting process or, even better for the data consistency, you may stop the MySQL process and take a cold backup. As you can see, it’s up to you what kind of consistency you want to achieve, keeping in mind that consistency comes with the price of downtime (longer or shorter) of that instance.

If you are using multiple EBS volumes and created a RAID using mdadm, then you need to take a snapshot of all the EBS volumes at the same time. This is a tricky process and there are tools which can help you here. The most popular one is ec2-consistent-snapshot. This tool gives you plenty of options to choose from. You can lock MySQL with ‘FLUSH TABLE WITH READ LOCK’, you can stop MySQL, you can freeze the filesystem. Please keep in mind that you need to perform a significant amount of testing to ensure the backup process works smoothly and does not cause issues. Luckily, with the recent introduction of large EBS volumes, the need for RAIDed setups in EC2 decreases - more workloads can now fit in a single EBS volume.

Please keep in mind that there are plenty of use cases where using xtrabackup instead of (or along with, why not?) EBS snapshots makes much more sense. For example, it’s really hard to take a snapshot every 5 minutes - xtrabackup’s incremental backup will work just fine. Additionally (and it’s true for all physical backups) you want to make a copy of binary logs, to have the ability to restore data to a certain point in time. You can use snapshots as well for that.

Provisioning new nodes using EBS snapshot

If we use EBS snapshots as backup method, we can use them to provision new nodes. It is very easy to provision a node in Galera cluster - just create an empty one, start MySQL and watch the full state transfer (SST). The main downside of SST is the time needed for it. It’s most probably using xtrabackup so, again, network throughput is crucial in overall performance. Even with fast networks, if we are talking about large data sets of hundreds of gigabytes or more, the syncing process will take hours to complete. It is independent of the actual number of write operations - e.g., even if we have a very small number of DML’s on a terabyte database, we still have to copy 1TB of data.

Luckily, Galera provides an option to make  an incremental state transfer (IST). If all of the missing data is available in the gcache on the donor node, only that will be transferred, without the need of moving all of the data.
We can leverage this process by using a recent EBS snapshot to create a new node - if the snapshot is recent enough, other members of the cluster may still have the required data in their gcache.

By default, the gcache is set to 128M, which is fairly small buffer. It can be increased though. To determine how long the gcache can store data, knowing its size is not enough - it depends on the writeset sizes and number of writesets per second. You can monitor ‘wsrep_local_cached_downto’ variable to know the last writeset that is still cached. Below is a simple bash script which shows you for how long your gcache can store data.

#!/bin/bash

wsrep_last_committed=$(mysql -e "show global status like 'wsrep_last_committed'" | grep wsrep_last_committed | awk '{print $2}')
wsrep_local_cached_downto=$(mysql -e "show global status like 'wsrep_local_cached_downto'" | grep wsrep_local_cached_downto | awk '{print $2}')
date
echo ${wsrep_last_committed}

while [ ${wsrep_local_cached_downto} -lt ${wsrep_last_committed} ]
do
    wsrep_local_cached_downto=$(mysql -e "show global status like 'wsrep_local_cached_downto'" | grep wsrep_local_cached_downto | awk '{print $2}')
    sleep 1s
done
date
echo ${wsrep_local_cached_downto}

Once we size the gcache according to our workload, we can start to benefit from it.

We would start by creating a node and then attach to it an existing EBS volume created from a snapshot of our data. Once the node is up, it’s time to check the grastate.dat file to make sure the proper uuid and sequence number are there. If you used a cold backup, most likely that data is already in place. If MySQL was online when the snapshot was taken, then you’ll probably see something like:

# GALERA saved state
version: 2.1
uuid:    dbf2c394-fe2a-11e4-8622-36e83c1c99d0
seqno:   -1
cert_index:

In this is the case, we need to get a correct sequence number by running:

$ mysqld_safe --wsrep-recover

In the result we should get (among other messages) something similar to:

150519 13:53:10 mysqld_safe Assigning dbf2c394-fe2a-11e4-8622-36e83c1c99d0:14 to wsrep_start_position

We are interested in:

dbf2c394-fe2a-11e4-8622-36e83c1c99d0:14 

That’s our uuid and sequence number - now we have to edit the grastate.dat file and set the uuid and seqno in the same way.

This should be enough (as long as the needed data is still cached on the donor node) to bring the node into the cluster without full state transfer (SST). Don’t be surprised - IST may take a while too. It really depends on the particular workload and network speed - you’d have to test in your particular environment to tell which way of provisioning is more efficient.

As always, when working with EBS snapshots, you need to remember the warmup process. Amazon suggests that the performance may be up to 50% lower if the volume is not warmed up. It is up to you if you’d like to perform the warmup or not but you need to remember that this process may takes several hours.If this is a planned scale-up, probably it is a good idea to set the  wsrep_desync to ‘ON’ and perform the warmup process.

Using Amazon Machine Images to speed up provisioning

As you may know, an EC2 instance is created from an AMI - image of the instance. It is possible to create your own AMI using either CLI or just clicking in the web console. Why are we talking about it? Well, AMIs may come in handy when you customized your nodes heavily. Let’s say you installed a bunch of additional software or tools that you use in your day-to-day operations. Yes, those missing bits can be installed manually when provisioning a new node. Or, those missing bits can be installed via Chef/Puppet/Ansible/you_name_it in the provisioning process. But both manual installation or an automated provisioning process can take some time. Why not rely on an AMI to deliver us the exact environment we want? You can setup your node the way you like, pick it in the web console and then choose “Image” -> “Create Image” option. An AMI will be created based on the EBS snapshot and you can use it later to provision new nodes.

AMI’s can also be created from existing snapshots. This is actually great because, with a little bit of scripting, one can easily bundle the latest snapshots with the AMI and create an image that includes an almost up to date data directory.

Auto scaling groups

Auto scaling groups (ASG) is a set of mechanisms in EC2 that allows you to setup a dynamically scalable environment in several clicks. So AWS takes care of creating and destroying instances to maintain the required capacity. This can be useful if you get a surge in traffic, or for availability reasons in case you lose a few instances and want them replaced.

You would need to define the instance size to create, the AMI to create those new instances from and a set of conditions determining when new instances should be created. A simple example would be: ASG should have minimum 3, max 9 instances, split in three availability zones. A new instance should be added when CPU utilization is higher than 50% for a period of 2h, one of instances should be terminated when CPU utilization will be less than 20% for a period of 2h.

This tool is mostly designed for hosts which can be created and terminated quickly and easily, especially those that are stateless. Databases in general are more tricky, as they are stateful and a new instance is dependent on IO to sync up its data. Instances that use MySQL replication are not so easy to spin up but Galera is slightly more flexible, especially if we combine it with automated AMI creation to get the latest data included when the instance comes up.

One main problem to solve is that the Galera nodes need a wsrep_cluster_address setup with IP addresses of the nodes in the cluster. It uses this data to find other members of the cluster and to join the group communication. It is not required to have all of the cluster nodes listed in this variable, there has to be at least one correct IP.

We can approach this problem twofold. We can setup a semi-auto scaling environment - spin up a regular Galera cluster, let’s say three nodes. This will be a permanent part of our cluster. As a next step, we can create an AMI with wsrep_cluster_address including those three IP addresses and use it for the ASG. In this way, every new node created by the ASG will join the cluster using an IP of one of those permanent nodes. This approach has one significant advantage - by having permanent nodes, we can ensure to have a node with full gcache. You need to remember that the gcache is an in-memory buffer and is cleared after node restart.

Using Simple Notification Service as a callback to ASG

Another approach would be to fully automate our auto-scaling environment. For that we have to find a way of checking when ASG decided to create a new node, or terminate an old one, before updating wsrep_cluster_address. We can do this using SNS. 

First of all, a new “topic” (access point) needs to be created and a subscription needs to be added to this topic. The trick here is to use http protocol for a subscription.

This way, notifications related to a given topic will be sent as a POST request to the given http server. It’s great for our needs because we can create a handler (it can be either a daemon or xinetd service that calls some script) that will handle the POST messages, parse them and perform some actions as defined in our implemented logic.

Once we have a topic and subscription ready, when creating ASG, you can pick one of the SNS topics as a place where notifications will be sent.

The whole workflow looks as below:

  1. One of the conditions was met and ASG scale up/down event has been triggered
  2. New instance is added (or an old one is removed)
  3. Once that is done, notification will be sent to the defined SNS topic
  4. Handler script listening on the http address defined for the SNS subscription parses the POST request and does it’s magic.

The magic mentioned in the last point can be done in many ways, but the final result should be to get the IP addresses of the current set of Galera nodes and update wsrep_cluster_address accordingly. It may also require node restart for the joining node (to actually connect to the cluster using the new set of IP’s from wsrep_cluster_address). You may also need to setup Galera segments accordingly should you want to use them. Maybe a proxy configuration will have to be updated also?

All this can be done in multiple ways. One of them would be to use Ansible + ec2.py script as a dynamic inventory and use tags to mark new instances that need configuration (you can setup a set of tags for instances created by ASG), but it can be done using any tool as long as it works for you.

The main disadvantage of this fully automated approach is that you don’t really control when a given instance will be terminated, which one will be picked up for a termination etc. It should not be a problem in terms of the availability (your setup should be able to handle instances going down at random times anyway) but it may cause some additional scripting to handle the dynamic nature. It will also be more prone to SST (compared to a hybrid static/dynamic approach described earlier). That is, unless you add logic to check the wsrep_local_cached_downto and pick a donor based on the amount of data in the gache instead of relying on Galera itself to automatically choose the donor.

One important point to remember is that Galera takes time to get up and running - even IST may take some time. This needs to be taken under consideration when creating autoscaling policies. You want to allow some time for a Galera node to get up to speed and take traffic before proceeding with adding another node to the cluster. You also don’t want to be too aggressive in terms of the thresholds that determine when a new node should be launched - as the launch process is taking time, you’d probably want to wait a bit to confirm the scale-up is indeed required.

Blog category:

ClusterControl 1.2.10 Released

$
0
0

The Severalnines team is pleased to announce the release of ClusterControl 1.2.10. This release contains key new features along with performance improvements and bug fixes. We have outlined some of the key new features below. 


  • Highlights of ClusterControl 1.2.10 include:
  • ClusterControl DSL (Domain Specific Language) 
  • Integrated Developer Studio (Developer IDE) 
  • Database Advisors/JS bundle 
  • On-premise Deployment of MySQL / MariaDB Galera Cluster (New implementation)
  • Detection of long running and deadlocked transactions (Galera)
  • Detection of most advanced (last committed) node in case of cluster failure (Galera)
  • Registration of manually added nodes with ClusterControl
  • Failover and Slave Promotion in MySQL 5.6 Replication setups 
  • General front-end optimizations 

For additional details about the release:

ClusterControl DSL (Domain Specific Language): We are excited to announce our new, powerful ClusterControl DSL, which allows you extend the functionality of your ClusterControl platform by creating Advisors, Auto Tuners or “mini Programs”. The DSL syntax is based on JavaScript, with extensions to provide access to ClusterControl’s internal data structures and functions. The DSL allows you to execute SQL statements, run shell commands/programs across all your cluster hosts, and retrieve results to be processed for advisors/alerts or any other actions. 

Integrated Developer Studio (Developer IDE): The ClusterControl Dev Studio provides a simple and elegant development environment to quickly create, edit, compile, run, test, debug and schedule your JS programs. This is pretty cool - you are able to develop database advisors or mini programs that automate database tasks from within your web browser. 

Advisors/JS Bundle: Advisors in ClusterControl are powerful constructs; they provide specific advice on how to address issues in areas such as performance, security, log management, configuration, storage space, etc. They can be anything from simple configuration advice, warning on thresholds or more complex rules for predictions or cluster-wide automation tasks based on the state of your servers or databases.
In general, advisors perform more detailed analysis, and produce more comprehensive recommendations than alerts.

s9s-advisor-bundle on Github:
We ship a set of basic advisors that are open source under an MIT licence and which include rules and alerts on security settings, system checks (NUMA, Disk, CPU), queries, innodb, connections, performance schema, Galera configuration, NDB memory usage, and so on. The advisors can be downloaded from Github. Through the Developer Studio, it is easy to import ClusterControl JS bundles written by our partners or community users, or export your own for others to try out. 

On-premise Deployment of MySQL/MariaDB Galera Cluster: We have rewritten the on-premises deployment functionality for Galera clusters. You can now easily deploy a Galera cluster with up to 9 DB nodes.

Detection of long running and deadlocked transactions: Deadlocks, also called deadly embrace, happens when two or more transactions permanently block each other. These can cause quite a number of problems, especially in a synchronous cluster like Galera. It is now possible to view these through the web UI.

Galera Recovery - Detection of most advanced (last committed) node: In the unfortunate case of a cluster-wide crash, where the cluster is not restarting, you might need to bootstrap the cluster using the node with the most recent data. The admin can now get information about the most advanced node, and use that to bootstrap the cluster.

Registration of manually added nodes with ClusterControl: In some cases, an admin might be using other automation tools, e.g., Chef or Puppet, to add nodes to an existing cluster. In that case, it is now easy to register these new nodes to ClusterControl so they show up in the UI.

Failover and Slave Promotion in MySQL 5.6 Replication Setups: For MySQL Replication setups, you can now promote a slave to a master from the UI. It requires that you are on MySQL 5.6, and use GTID.

We encourage you to provide feedback and testing. If you’d like a demo, feel free to request one

With over 7,000 users to date, ClusterControl is the leading, platform independent automation and management solution for MySQL, MariaDB, MongoDB and PostgreSQL. 

Thank you for your ongoing support, and happy clustering!

For additional tips & tricks, follow our blog: http://www.severalnines.com/blog/.

Blog category:

Press Release: Severalnines creates programmable DevOps platform to manage leading open source databases

$
0
0

New ClusterControl release includes customisation language for management and automation

 
Stockholm, Sweden and anywhere else in the world - 27 MAY 2015 - Severalnines, the provider of database infrastructure management software, today launched the latest version of its ClusterControl platform. This database automation product cuts down time for businesses to deploy, monitor, manage and scale multiple open source databases. With this latest release, Severalnines is helping database and system administrators take full control of their database resources.  

Management of databases is increasing in complexity as companies need to meet higher uptime requirements for their data, plus provide security when it is distributed across public/private clouds in a diverse, virtualised infrastructure. Customisation of management tools with simple parameters will not work as database environments become more complex.

ClusterControl now offers users the ability to create their own custom programs, also called advisors, to automate more tasks and increase productivity via an Integrated Developer Studio. Advisors are mini-programs that provide advice on how to address issues in areas such as database performance, security, scalability, configuration and capacity planning. This new programmable platform also builds the foundation for the ClusterControl advisors architecture. 
 
The new ClusterControl and its Developer Studio allow IT professionals to: 

  • Test and secure databases with security audits
  • Dynamically tune any database configuration with custom built advisors
  • Use predictive analytics to calculate compute, storage and network capacity at any time
  • Automatically install and setup programs remotely on a host server

For additional details about the release:

 
Here are the new product specification details:
 
ClusterControl DSL (Domain Specific Language): ClusterControl DSL, allows IT administrators to extend the functionality of the ClusterControl platform by creating advisors. With its syntax based on JavaScript (JS), ClusterControl DSL can execute SQL statements, run shell commands across all cluster hosts and retrieve results for advisors to process.
 
Integrated Developer Studio: The ClusterControl Developer Studio provides a simple and appealing development environment to quickly create, edit, compile, run, test, debug and schedule your JavaScript programs.
 
Advisors: Advisors in ClusterControl provide specific advice on how to address database issues such as performance, security, log management and configuration. This advice can range from setting up a simple alert system to a complex prediction engine for cluster-wide automation. For community ClusterControl users, a set of open source advisors are available under an MIT licence on GitHub.
 
Vinay Joosery, Co-Founder and CEO of Severalnines said: “ClusterControl’s programming environment is like an open system that gives real-time access to the entire database infrastructure, from workload metrics to configuration files, logs and even direct access to the complete Linux BASH environment of the hosts. With the latest release of ClusterControl, we’re allowing IT to control their database environment in ways that was previously difficult to accomplish, or even outright impossible.”
 
Alexander Yu, Vice President of Products, added: “Our language is effective for flexible automation and programming. IT teams can use mathematical and statistical functions to act on time series data sets, execute remote commands on their cluster hosts and run SQL statements across their servers. Sticking to our community ethos, the advisors we make available are under an open source MIT licence, so users can either improve our work or create their own.”

The new ClusterControl will be presented by Johan Andersson, CTO at Severalnines, during a live demo session on June 9th; users can register here.


About Severalnines

Severalnines provides automation and management software for database clusters. We help companies deploy their databases in any environment, and manage all operational aspects to achieve high-scale availability.

Severalnines' products are used by developers and administrators of all skills levels to provide the full 'deploy, manage, monitor, scale' database cycle, thus freeing them from the complexity and learning curves that are typically associated with highly available database clusters. The company has enabled over 7,000 deployments to date via its popular online database configurator. Currently counting BT, Orange, Cisco, CNRS, Technicolor, AVG, Ping Identity and Paytrail as customers.  Severalnines is a private company headquartered in Stockholm, Sweden with offices in Singapore and Tokyo, Japan. To see who is using Severalnines today visit, http://www.severalnines.com/company.


Blog category:

Introducing ClusterControl Developer Studio and Creating your own Advisors in JavaScript

$
0
0

Developer Studio.. JavaScript.. ClusterControl DSL.. database clusters.. huh? what the heck is going on here? This might seem like a mix up of random tech terms, but it’s really a pretty cool feature that we’ve just released.  

With ClusterControl 1.2.10, we introduced our new, powerful ClusterControl DSL (Domain Specific Language), which allows you to extend the functionality of your ClusterControl platform by creating Advisors, Auto Tuners, or “mini Programs”. The DSL syntax is based on JavaScript, with extensions to provide access to ClusterControl’s internal data structures and functions. The DSL allows you to execute SQL statements, run shell commands/programs across all your cluster hosts, and retrieve results to be processed for advisors/alerts or any other actions.

Join us for the 1.2.10 release webinar held by Johan Andersson, our CTO, on Tuesday June 9th to see it in action. There’ll be a live demo of the new ClusterControl and a Questions & Answers session. 

In the meantime, this blog shows you what our new Developer Studio is all about!

So, you can create these advisors right within your web browser using our Developer Studio. The ClusterControl Developer Studio is a simple and elegant development environment to quickly create, edit, compile, run, test, debug and schedule your JavaScript programs.

What are Advisors?

Advisors in ClusterControl are powerful constructs; they provide specific advice on how to address issues in areas such as performance, security, log management, configuration, storage space, etc. They can be anything from simple configuration advice, warning on thresholds or more complex rules for predictions, or even cluster-wide automation tasks based on the state of your servers or databases. 

ClusterControl comes with a set of basic advisors that include rules and alerts on security settings, system checks (NUMA, Disk, CPU), queries, innodb, connections, performance schema, Galera configuration, NDB memory usage, and so on. The advisors are open source under an MIT license, and available on GitHub. Through the Developer Studio, it is easy to import new advisors as a JS bundle, or export your own for others to try out.


Installation

You can install ClusterControl on a dedicated VM using the following:

$ wget http://www.severalnines.com/downloads/cmon/install-cc
$ chmod +x install-cc
# as root or sudo user
$ ./install-cc

For more information on system requirements, etc., please see http://www.severalnines.com/getting-started.


Developer Studio interface

Developer Studio is available under Manage -> Developer Studio. 

On the left panel, you will see a list of scripts (or Advisors) that are available. These are written in a JavaScript-like language. ClusterControl comes with a default set of Advisors, but you can also create your own Advisors, or import new ones. 
Let’s try to open one of the scripts that are bundled with ClusterControl.

In the right hand panel, you will see a couple of buttons that allow you to:

  • save the file
  • move it around between different subdirectories
  • remove it completely 
  • compile the script 
  • compile and run 
  • schedule it as an advisor.

The arrow next to the “Compile and Run” button allows us to change settings for a script and, for example, pass some arguments to the main() function.

What does a script look like?

Now, let’s see what a script looks like. Our example script checks if innodb has had to wait for checkpoints to complete. Once we are happy with the script, we can schedule it as an advisor.

We define a threshold for this check and some messages that will be used by an advisor, depending on whether the check passes or raises a warning.

#include "common/mysql_helper.js"
#include "cmon/alarms.h"

/**
 * Checks if innodb has had to wait for checkpoints to complete.
 */
 
var WARNING_THRESHOLD=0;
var TITLE="Innodb_buffer_pool";
var ADVICE_WARNING="Innodb_buffer_pool_wait_free > 0 indicates that the"" Innodb_buffer_pool is too small and InnoDb had"" to wait for a checkpoint to complete."" Increase Innodb_buffer_pool.";
var ADVICE_OK="Innodb has not waited for checkpoint." ;

Then we have a main() function, where the main part of the script is located. We get the list of the MySQL nodes from ClusterControl. We also define advisorMap, which will be returned by main() function and used if we schedule this script to run as an advisor.

function main()
{
    var hosts     = cluster::mySqlNodes();
    var advisorMap = {};

Next, iterate through host array and prepare data structures for the main part.

    for (idx = 0; idx < hosts.size(); ++idx)
    {
        host        = hosts[idx];
        map         = host.toMap();
        connected     = map["connected"];
        var advice = new CmonAdvice();

Now, we are reading ‘Innodb_buffer_pool_wait_free’ status from the host and we store it into the variable.

        if(!connected)
            continue;
        if(checkPrecond(host))
        {
            var Innodb_buffer_pool_wait_free = readStatusVariable(host,  
                                          "Innodb_buffer_pool_wait_free").toInt();

We need to do a sanity check that we actually managed to get the data correctly, we also prepare another message that will be passed to the advisor.

            if(Innodb_buffer_pool_wait_free == false)
            {
                msg = "Not enough data to calculate";
            }
            justification = "Innodb_buffer_pool_wait_free = " +  
                                  Innodb_buffer_pool_wait_free;

Finally, the main check comes in - we test if the value collected passed the defined threshold or not, and set the result of the check accordingly.

            if(Innodb_buffer_pool_wait_free > WARNING_THRESHOLD)
            {
                advice.setSeverity(Warning);
                msg = ADVICE_WARNING;

            }
            else
            {
                advice.setSeverity(Ok);
                msg = ADVICE_OK;

            }
            advice.setJustification(justification);
        }
        else
        {
            msg = "Not enough data to calculate";
            advice.setSeverity(Ok);
        }

At the end, we need to prepare the data for the advisor and return it.

        advice.setHost(host);
        advice.setTitle(TITLE);
        advice.setAdvice(msg);
        advisorMap[idx]= advice;
    }
    return advisorMap;
}

Should you want to use this script as an advisor, as mentioned earlier, you can do so by clicking on the ‘Schedule Advisor’ button. You can setup how often the given script will be executed using a cron job syntax:

The results of the executed advisors can be found by clicking the Advisors button, and also under Performance -> Advisors.

In this example we used the readStatusVariable() method but we can also use SQL to get interesting data directly from the MySQL instances. 
The following snippet checks if there are MySQL users allowed to access from any host. This time we use getValueMap() method to run an SQL statement on the given host. Then we can iterate over the result set and do some logic or just print the info as in this example.

        ret = getValueMap(host, "SELECT User,Host FROM mysql.user WHERE host='%'");
        if(ret == false)
            print(host, ": No problem detected.");
        else
        {
            for(i=0; i<ret.size(); ++i)
            {
                print(host, ": '" + ret[i][0] + 
                      "' is allowed to access from " + 
                      ret[i][1]) + ".";
            }
        }


Creating a new script

Let’s try to create a new file. First, we click on the “New” button.

In this example, we’ll get access to the ClusterControl statistics to watch the number of selects per second and raise an alert if needed. This script is based on the “Galera template” so once you create a new script, some of the skeleton code will be automatically included.

#include "common/mysql_helper.js"

/**
 * Checks the qps for selects 
 * 
 */ 
var WARNING_THRESHOLD=100;
var TITLE="Select QPS check";
function main()
{
    var hosts     = cluster::galeraNodes();
    var advisorMap = {};

    for (idx = 0; idx < hosts.size(); ++idx)
    {
        host        = hosts[idx];
        map         = host.toMap();
        connected     = map["connected"];
        var advice = new CmonAdvice();
        print(host);
        if(!connected)
            continue;
        if(checkPrecond(host))
        {
         // Get the current time
            var endTime   = CmonDateTime::currentDateTime();
            // set the start time to 10s ago 
            var startTime = endTime - 10; 
          // Get the sql stats
            var stats = host.sqlStats(startTime, endTime);
            // we are interested in COM_SELECT
            var select_arr     = stats.toArray("COM_SELECT");
     // and interval, to calculate per second average 
            var interval_arr    = stats.toArray("interval"); 
        
            //calculate sum of selects over the samples
            var com_select = sum(select_arr);      
            //calculate time period for a sample, ms -> s conversion       
            var interval = sum(interval_arr)/1000; 
         // calculate selects/s based on the time period length
            var com_select_qps = com_select / interval; 


            // uncomment this line to get the output in the Messages section below
            //print(host, ": ", com_select_qps); w
          

           if( com_select_qps > WARNING_THRESHOLD)
           {
               advice.setJustification("Number of selects per second is larger than " 
                                         + WARNING_THRESHOLD + ": " + com_select_qps);
               advice.setSeverity(1);
           }

           else
           {
               advice.setJustification("Number of selects per second is within”
                                       " limits (" + WARNING_THRESHOLD +" qps): " + 
                                       com_select_qps);
               advice.setSeverity(0);
           }

        }
        else
        {
            msg = "Not enough data to calculate";
            advice.setJustification("there is not enough load on"" the server or the uptime is too little.");
            advice.setSeverity(0);
        }
        advice.setHost(host);
        advice.setTitle(TITLE);
        //advice.setAdvice(msg);
        advisorMap[idx]= advice;
    }
    return advisorMap;
}

The new thing here, compared to the scripts we looked at earlier, is the way ClusterControl handles the statistics sampling - we can get them using:

stats = host.sqlStats(startTime, endTime); 

You can always check the whole data set by using:

print(stats);

Then we need to generate an array containing interesting data from the whole statistics, e.g., an array containing data for a particular interval.

            // we are interested in COM_SELECT
            var select_arr     = stats.toArray("COM_SELECT");
            // and interval, to calculate per second average
            var interval_arr    = stats.toArray("interval"); 

In general, the sampling in ClusterControl is based on intervals. The latest data is by default close to 4000ms, but it may change. As the data ages, it is aggregated and rolled up into intervals of tens of minutes or several hours. There may be multiple samples needed to cover the timeframe we want. Also, those samples may not cover it completely or may cover additional timeframe. That’s why we have to sum all of the data from all of the samples and then sum the interval (timeframe for a given sample). Then, finally, we can divide the sum of selects by the sum of intervals, convert the value from milliseconds to seconds to get the result of average selects per second.

            //calculate sum of selects over the samples
            var com_select = sum(select_arr); 
            //calculate time period for a sample, ms -> s conversion
            var interval = sum(interval_arr)/1000; 
            // calculate selects/s based on the time period length
            var com_select_qps = com_select / interval; 

The rest is what we saw in our earlier example - we compare the result with a defined threshold and build the advisor data accordingly.


How to execute commands on remote hosts?

ClusterControl DSL gives you the ability to execute commands on remote hosts using SSH connection. It shares ClusterControl’s access so it has the same privileges. The example below is not exactly designed to do anything useful, but it gives you an idea of how it works. 

#include "common/mysql_helper.js"

function main()
{
    var hosts     = cluster::galeraNodes();

    for (idx = 0; idx < hosts.size(); ++idx)
    {
        host        = hosts[idx];
        map         = host.toMap();
        connected     = map["connected"];
        var advice = new CmonAdvice();

        print("############## Host: " + host.toString() + " ##############");
        // Execute remote command and retrieve results
        retval = host.system("ifconfig  | grep eth0 -A 1 | awk 'match($0, /[0-9]{1,3}\.[0-9]{1,3}\.[0-9]{1,3}\.[0-9]{1,3}/) {print substr($0, RSTART, RLENGTH)}'");
        ip = retval['result'];
        print("IP collected from ifconfig: " + ip);
        print("Echoing ip to /tmp/ssh_js_ipaddr");
        // Create file on the remote host
        retval = host.system("echo '" + ip + "'> /tmp/ssh_js_ipaddr");
        // Check the status of the command
        print("Status of echo: " + retval);
        if (retval['success'] == true)
        {
            retval = host.system("cat /tmp/ssh_js_ipaddr");
            print("Output of cat /tmp/ssh_js_ipaddr: " + retval['result']);
            // Remove the file on remote server
            host.system("rm /tmp/ssh_js_ipaddr");
        }
        
        retval = host.system("ls -alh /tmp/ssh_js_ipaddr");
        print("We expect error here, /tmp/ssh_js_ipaddr"" should not exist by now" + retval);
        print("");
        
    }    
}

As you can see, we executed remote ifconfig, stored the result in a variable in our script, used that variable to modify data on the remote servers and finally removed the file on remote hosts.

Such options can be used to build all types of the scripts, starting from creating advisors based on some status counters accessible from the console, to scripts which would perform some kind of maintenance (custom-tailored backups for example). It may also be useful for periodical monitoring of some non-MySQL activity running in the background (let’s say for example, to check if pt-stalk created new files in its log directory or if it’s running at all).

As you can see, ClusterControl DSL and the Developer Studio gives you a significant number of additional options for customizing your monitoring patterns and build new ones, so you can extend ClusterControl to solve some specific challenges in your environment. We’d love to hear your opinion on this. 

Blog category:


New Features Webinar: ClusterControl 1.2.10 - Fully Programmable DevOps Platform - Live Demo

$
0
0

Following the release of ClusterControl 1.2.10 a week ago, we are excited to demonstrate this latest version of the product on Tuesday next week, June 9th.

Join our CTO, Johan Andersson, who will be discussing and demonstrating the new ClusterControl DSL, Integrated Developer Studio and Database Advisors, which are some of the cool new features we’ve introduced with ClusterControl 1.2.10.

New Features Webinar: ClusterControl 1.2.10

DATE & TIME

Europe/MEA/APAC
Tuesday, June 9th at 09:00 (UK) / 10:00 CEST (Germany, France, Sweden)
Register Now

North America/LatAm
Tuesday, June 9th at 10:00 Pacific Time (US) / 13:00 Eastern Time (US)
Register Now


SPEAKER


Johan Andersson, CTO, Severalnines

Highlights of ClusterControl 1.2.10 include:

  • ClusterControl DSL (Domain Specific Language)
  • Integrated Developer Studio (Developer IDE)
  • Database Advisors/JS bundle
  • On-premise Deployment of MySQL / MariaDB Galera Cluster (New implementation)
  • Detection of long running and deadlocked transactions (Galera)
  • Detection of most advanced (last committed) node in case of cluster failure (Galera)
  • Registration of manually added nodes with ClusterControl
  • Failover and Slave Promotion in MySQL 5.6 Replication setups
  • General front-end optimizations

For additional details about the release:

Join us for this live webinar, where we’ll be discussing and demonstrating the latest features of ClusterControl!

We look forward to “seeing” you there and to insightful discussions!

If you have any questions or would like a personalised live demo, please do contact us.


ABOUT CLUSTERCONTROL

Setting up, maintaining and operating a database cluster can be tricky. ClusterControl gives you the power to deploy, manage, monitor and scale entire clusters efficiently and reliably. ClusterControl supports a variety of MySQL-based clusters (Galera, NDB, 5.6 Replication), MariaDB as well as MongoDB/TokuMX-based clusters and Postgres. With over 7,000 users to date, ClusterControl is the leading, platform independent automation and management solution for the MySQL, MongoDB and Postgres databases. 

Blog category:

Become a DBA blog series - Monitoring and Trending

$
0
0

So, you’ve been working with MySQL for a while and now are being asked to manage it. Perhaps your primary job description is not about support and maintenance of the company’s databases (and data!), but now you’re expected to properly maintain one or more MySQL instances. It is not uncommon that developers, or network/system administrators, or DevOps folks with general backgrounds, find themselves in this role at some point in their career. 

So, what does a DBA do? We know that a DBA manages the company’s databases, what does that mean? In this series of posts, we’ll walk you through the daily database operations that a DBA does (or at least ought to!).

We plan on covering the following topics, but do let us know if we’ve missed something:

  • Monitoring tools
  • Trending
  • Periodical healthchecks
  • Backup handling
  • High Availability
  • Common operations (online schema change, rolling upgrades, query review, database migration, performance tuning)
  • Troubleshooting
  • Recovery and repair
  • anything else?

In today’s post, we’ll cover monitoring and trending.

Monitoring and Trending

To manage your databases, you would need good visibility into what is going on. Remember that if a database is not available or not performing, you will be the one under pressure so you want to know what is going on. If there is no monitoring and trending system available, this should be the highest priority. Why? Let’s start by defining ‘trending’ and ‘monitoring’. 

A monitoring system is a tool that keeps an eye on the database servers and alerts you if something is not right, e.g., a database is offline or the number of connections crossed some defined threshold. In such case, the monitoring system will send a notification in some defined way. Such systems are crucial because, obviously, you want to be the first to be informed if something’s not right with the database.

On the other hand, a trending system will be your window to the database internals. It will provide you with graphs that show you how those cogwheels are working in the system - the number of queries per second, how many read/write operations the database does on different levels, are table locks immediate or do queries have to wait for them, how often a temporary table is created, how often it is created on disk, and so on. If you are familiar with MySQL internals, you’ll be better equipped to analyze the graphs and derive useful information. Else, you may need some time to understand these graphs. Some metrics are pretty self-explanatory, others perhaps not so obvious. But in general, it’s probably better to have more data than not to have any when it’s needed.

Data is presented as graphs for better visibility - from graphs, the human mind can easily derive trends and locate anomalies. The trending system also gives you an idea of how things change over time - you need this visibility in both real time and for historical data, as things happen also when people sleep. If you have been on-call in an ops team, it is not unusual for an issue to have disappeared by the time you get paged at 3am, wake up, and log into the system.

Monitoring - best practices

There are many many monitoring solutions out there, chances are you probably have one of the following options already in your infrastructure: 

Nagios:

Zabbix:

MONyog:

ClusterControl:

All of those tools have their pros and cons. Some are only for monitoring, others also provide you with trending. A good monitoring system should allow you to customize the thresholds of alerts, their severity, etc., and fine-tune it to your own needs. You should also be able to integrate with external paging services like PagerDuty.

How you’d like your monitoring setup to look like is also up to individual preferences. What we’d suggest is to focus on the most important aspects of your operations. As a general rule of thumb, you’d be interested to know if your system is up or not, if you can connect to the database, whether you can execute meaningful read and write queries (ideally something as close to the real workload as possible, for example you could read from a couple of production tables). Next in the order of importance would be to check if there’s an immediate threat to the system’s stability - high CPU/memory/disk utilization, lack of disk space. You want to have your alerts as actionable as possible - being waken up in the middle of the night, only to find that you can’t do anything about the alert, can be frustrating in the long run.

Trending - best practices

Next step would be to install some trending software. Again, similar to the monitoring tools, there is a plethora of choices. Best known are Cacti:

Munin:

and Zabbix:

ClusterControl, in addition to the cluster management, can also be used as a trending system. 

There are also SaaS-based tools including Percona Cloud Tools and VividCortex.

Having a trending solution is not enough - you still have to know what kind of graphs you need. MySQL-focused monitoring tools will work great as they are focused on MySQL - they were created to bring to the MySQL DBA as much information as possible. Other tools that are of more generic nature will probably have to be configured. It would be outside the scope of this blog to go over such configurations, but we’d suggest to look at Percona Monitoring Plugins. They are prepared for Cacti and Zabbix (when it comes to trending) and you can easily set them up if you have chosen one of those tools. If not, you can still use them as a guide as to what MySQL metrics you want to have graphed and how to do that.

Once you have both monitoring and trending tools ready, you can go to the next phase - gathering the rest of the tools you will need in your day-to-day operations

CLI tools

In this part, we’d like to cover some useful CLI tools that you may want to install on your MySQL server. First of all, you’ll want to install Percona Toolkit. It is a set of tools designed to help DBAs in their work. Percona Toolkit covers tasks like checking data consistency across slaves, fixing data inconsistency, performing slow query audits, checking duplicate keys, keeping track of configuration changes, killing queries, checking grants, gathering data during incidents and many others. We will be covering some of those tools in the coming blogs, as we discuss different situations a DBA may end up into.

Another useful tool is sysbench. This is a system benchmarking tool with an OLTP test mode. That test stresses MySQL and allows you to get some understanding of the system’s capacity. You can install it by running apt-get/yum but you probably want to make sure that you have version 0.5 available - it included support for multiple tables and the results are more realistic. If you’d like to perform more detailed tests and closer to your “real world” workload, then take a look at Percona Playback - this tool can use “real world” queries in form of a slow query log or tcpdump output and then replay those queries on the test MySQL instance. While it might sound strange, performing such benchmarks to tune a MySQL configuration is not uncommon, especially at the beginning when a DBA is learning the environment. Please keep in mind that you do not want to perform any kind of benchmarking (especially with Percona Playback) on the production database - you’ll need a separate instance setup for that.

Jay Janssen’s myq_gadgets is another tool you may find useful. It is designed to provide information about the status of the database - statistics about com_* counters, handlers, temporary tables, InnoDB buffer pool, transactional logs, row locking, replication status. If you are running Galera cluster, you may benefit from ‘myq_status wsrep’ which gives you nice insight into writeset replication status including flow control.

At some point you’ll need to perform a logical dump of your data - it can happen earlier, if you already make logical backups, or later - when you’ll be upgrading your MySQL to a new major version. For larger datasets mysqldump is not enough - you may want to look into a pair of tools: mydumper and myloader. Those tools will work together to create a logical backup of your dataset and then load it back to the database. What’s important - they can utilize multiple threads which speeds up the process significantly compared to mysqldump. Mydumper needs to be compiled and it’s sometimes hard to get it to work. Recent versions became more stable though and we’ve been using it successfully.

Periodical health checks

Once you have all your tools set up, you need to establish a routine to check the health of the databases. How often you’d like to do it is up to you and your environment. For smaller setups daily checks may work. For larger setups you probably have to do it every week or so. The reasoning behind it is that such regular checks should enable you to act proactively and fix any issues before they actually happen. Of course, you will eventually develop your own pattern but here are some tips on what you may want to look at.

First of all, the graphs! This is one of the reasons a trending system is so useful. While looking at the graphs, you want to ensure no anomalies happened since the last check. If you noticed any kind of spikes, drops or, in general, unusual patterns, you probably want to investigate further to understand what happened exactly. It’s especially true if the pattern is not healthy and may be the cause (or result) of a temporary slowdown of the system.

You want to look at the MySQL internals and host stats. Most important graphs would be the ones covering number of queries per second, handler statistics (which gives you information about how MySQL accesses rows), number of connections, number of running connections, I/O operations within InnoDB, data about row and table level locking. Additionally, you’re interested in all data on host level - CPU utilization, disk throughput, memory utilization, network traffic. See the “Related resources” section at the end of this post for a list of relevant blogs around monitoring metrics and their meaning. At first, such a check may take a while but once you get familiar with your workload and its patterns, you won’t need as much time as at the beginning.

Another important part of the health check is going over the health of your backups. Of course, you might have backups scheduled. Still, you need to make sure that the process works correctly, your backups are actually running and backup files are created. We are not talking here about recovery tests (such tests should be performed but it’s not really required to do it daily or on weekly basis - on the other hand, if you can afford to do it, it’s even better). What we are talking here is more about simple checks. If the backup file was created, does it have the correct file size (if a data set has 100GB, then a 64KB backup file may be suspicious)? Has it been even created in the first place? If you use compression and you have some disk space free, you may want to try and decompress the archive to verify it’s correct (as long as it’s feasible in terms of the time needed for decompression). How’s the disk space status? Do you have enough free disk on your backup server? If you copy backups to a remote site for DR purposes, the same set of checks apply for the DR site.

Finally, you probably want to look at the system and MySQL logs - check kernel log for any symptoms of hardware failure (disk or memory sometimes send warning messages before they fail), check MySQL’s error log to ensure nothing wrong is going on.

As we mentioned before, the whole process may take a while, especially at the beginning. Especially the graph overview part may take time, as it’s not really possible to automate it - the rest of the processes is rather straightforward to script. With a growing number of MySQL servers, you will probably have to relax the frequency between checks due to time needed to perform a health check - maybe you’ll need to prioritize, and cover the less important parts of your infrastructure every other week?

Such healthcheck is a really useful tool for a DBA. We mentioned already that it helps to proactively fix errors before they start to create an issue, but there’s one more important reason. You might not always up to date when it comes to the new code that has been introduced in production. In the ideal world, each SQL code would have been reviewed by a DBA. In the real world, though, it’s rather uncommon. As a result of that, it may happen that the DBA is surprised by new workload patterns that start showing up. The good thing is that, once they are spotted, the DBA can work with developers to fix or optimize schemas and SQL queries. Health checks are one of the best tools to catch up on such changes - without them, a DBA would not be aware of bad code or database design that may eventually lead to a system outage.

We hope this short introduction will give you some information on how you may want to setup your environment and what tools you may want to use. We also hope that the first health checks will give you a good understanding of your system’s performance and help you understand any pain points that may already be there. In our next post, we will cover backups.

Related resources


Blog category:

Become a MySQL DBA blog series - Backup and Restore

$
0
0

It is not uncommon that developers, network/system administrators, or DevOps folks with general backgrounds, find themselves in a DBA role at some point in their career. So, what does a DBA do? In the previous post, we covered monitoring and trending practices, as well as some popular tools that you might find handy in your day to day work. 

We’ll continue this blog series with another basic but crucial DBA responsibility - taking backups of your data. Backup and restore is one of the most important aspects of database administration. If a database crashed and there was no way to recovery it, any resulting data loss might lead to devasting results to a business. One could argue that you can protect against crashes by replicating to multiple servers or data centers. But if it is an application error that propagates to all instances, or a human dropping a part of a database by mistake, you will probably need to restore from backup.

Different backup methodologies

There are multiple ways to take a backup of a MySQL database, but we can divide these methods into two groups - logical and physical.

Logical backups contain data that is exported using SQL commands and stored in a file. This can be, for e.g., a set of SQL commands (INSERTs), that, when executed, will result in restoring a content of the database. It does not have to be SQL code, it can be anything that is restorable - you can as well use SELECT … INTO OUTFILE to generate a file with your database contents. With some modifications to the output file’s syntax, you can store your backup in CSV files.

Physical backups are copies of physical database files. Here, we would make a binary copy of a whole database by, for example, copying all of the files or by making a snapshot of a volume where data directory is located.

A logical backup is usually slower than a physical one, because of the overhead to execute SQL commands to get the data out and then to execute another set of SQL commands to get the data back into the database. This is a severe limitation that tends to prevent the logical backup from being a single backup method on large (high tens or hundreds of gigabytes) databases. On the other hand, a major advantage of the logical backup is the fact that, having all data in the SQL format, you can restore single rows.

Physical backups are not that flexible - while some of the methods make it possible to restore separate tables, you cannot go down to row level. On the other hand, this is a fastest way to backup and restore your database - you are limited only by the performance of your hardware - disk speed and network throughput will be the main limiting factor.

One more important concept, when it comes to the MySQL backup, is point in time recovery. A backup, whether logical or physical, takes place at a given time. This is not enough, you have to be able to restore your database to any point in time, also to a point which happened between the backups. In MySQL, the main way to handle point in time recovery is to use binary logs to replay the workload. With that in mind, a backup is not complete unless you make a copy of the binlogs along with it.

Logical backup methods

mysqldump

The most known method is definitely mysqldump, a CLI tool that enables the DBA to create an SQL dump of the database. Mysqldump is a single-threaded tool and this is its most significant drawback - performance is ok for small databases but it becomes quickly unacceptable if the data set grows to tens of gigabytes. If you plan to use mysqldump as a mean of taking backups, you need to keep a few things in mind. First, by default mysqldump doesn’t include routines and events in its output - you have to explicitly set --routines (-R) and --events (-E) flags. Second, if you want to take a consistent backup then things become tricky. As long as you use InnoDB only, you can use --single-transaction flag and you should be all set. You can also use --apply-slave-statements to get the CHANGE MASTER statements at the beginning of the dump if you plan to create a slave using the backup. If you have other non-transactional tables (MyISAM for example), then mysqldump will have to lock the whole database to ensure consistency. This is a serious drawback and may be one of the reasons why mysqldump won’t work for you.

By default, mysqldump creates a file where you’ll first find SQL to create the schema and then SQL to restore data. To have more flexibility, you may change this behavior and script the backup in such a way that it creates a schema dump first and then the rest of the data. Additionally, you may also want to script the backup process so that it stores separate tables in separate sql files. This will come in handy when you need to restore several rows or to compare current data with the previous day’s data. It’s all about the file size: separate dumps, created per table, will likely to be smaller and more manageable. E.g., in case you want to use a CLI tool to find a given row in the SQL file.

SELECT … INTO OUTFILE

This is more of a way how mysqldump works rather than a separate backup method, but it’s distinct enough to be included here. Mysqldump can be executed in a mode where, instead of SQL syntax, it will generate a backup in some other way. In general, its format is similar to CSV with a difference that the actual format can be defined by the user. By default, it is tab-separated instead of comma-separated.
This format is faster to load than SQL dump (you can use LOAD DATA INFILE to make it happen) but it is also harder to use to restore a single row. Most people probably don’t remember LOAD DATA INFILE syntax, while almost everybody can run SQL.

Mydumper/myloader

Those tools work in pair to overcome the main pain-point of mysqldump - single thread. Mydumper can be used to generate a backup of the data (and data only, you need also to use mysqldump --no-data to get a dump of the schema) and then load it. Both processes can use multiple threads. You can either split the workload per table or you can define a size of a chunk and then large tables will also be worked on by numerous threads. It’s still a logical backup so the process may still take a while. Based on numbers reported by different users, mydumper can load data up to 2-3 times faster. The process may still take days, though - depending on the database size, row size etc.

Even if the restore time is not acceptable for your data set, you still may be interested in mydumper because of periodical MySQL upgrades. For any major version upgrade (like 5.5 -> 5.6 or upcoming 5.6 -> 5.7), the recommended way for an upgrade is to perform a logical dump of the data and then load it back up. In such a case, time is not that crucial but it is still much better to finish the restore in 2-3 days using mydumper/myloader rather than 6 - 9 days using mysqldump.

Physical backup methods

xtrabackup

Percona’s xtrabackup is the backup method for MySQL. It is a tool that allows the DBA to take a (virtually) non-blocking snapshot of the InnoDB database. It works by copying the data files physically from one volume to another location. You can also stream the backup over the network, to a separate backup host where the backup will be stored. While copying the data, it keeps an eye on the InnoDB redo log and writes down any change that happened in the meantime. At the end, it executes FLUSH TABLES WITH READ LOCK (that’s why we used a word ‘virtually’) and finalizes the backup. Thanks to the last lock, the backup is consistent. If you use MyISAM tables, xtrabackup is more impacting as the non-transactional tables have to be copied over the network while FTWRL is in place - this, depending on the size of those tables, may take a while. During that time, no query will be executed on the host.

Restore is pretty simple - especially if you apply redo logs to the backup taken. Theoretically speaking, you could as well start MySQL without any further actions but then InnoDB recovery will have to be performed at the start. This process takes time. Preparing the backup first (by applying redo logs) can be done in its own time. When the backup needs to be (quickly) restored, you won’t have to go over this process. To speed up the backup preparing phase (using --apply-log) you may increase memory available for xtrabackup using --use-memory flag. As long as you have several gigabytes of free memory, you can use them here to speed up the process significantly.

Xtrabackup is probably the most popular tool out there and it’s not without reason. It is very flexible, you can use multiple threads to copy the files quicker (as long as your hardware permits it), you can use compression to minimize size of the backup. As we mentioned, it is possible to create a backup locally or stream it over the network using (for example) an SSH tunnel or netcat. Xtrabackup allows you to create incremental backups which take significantly less disk space than the full one and won’t take as much time. When restoring, though, it is a slower process as deltas have to be applied one after another and it may take significant amount of time.

Another feature of xtrabackup is its ability to backup single schemas or even tables. It has its uses but also limitations. First of all, it can be used to restore several rows that got dropped accidently. It is still a less efficient way of doing this than restoring that data from an SQL dump, as you’d have to create a separate host, restore the given table, dump missing rows and load them onto the production server - you cannot restore a whole table because you’ll be missing data that happened after the backup was taken. It is possible to work it out with binary logs but it will take too much time to be feasible. On the other hand, if a whole table or schema is missing, you should be able to restore that pretty easily.

The main advantage of the xtrabackup over logical backups is its speed - performance is limited by your disk or network throughput. On the other hand, its much harder to recover single rows from the database. The ideal use case for xtrabackup is to recover a whole host from scratch or provision a new server. It comes with options to store information about MySQL replication or Galera writeset replication along with the backup. This is very useful if you need to provision a new replication slave or a new node in a cluster.

Snapshots

We’ll be talking here about backing up MySQL using snapshots - it does not matter much how you are taking those snapshots. It can be either LVM installed on a host (using LVM is not an uncommon way of setting up MySQL servers) or it could be a “cloudish” snapshot - EBS snapshot or it’s equivalent in your environment. If you use SAN as a storage for your MySQL server and you can generate a snapshot of a volume, it also belongs here. We will focus mostly on the AWS, though - it’s the most popular cloud environment.

In general, snapshots are a great way of backing up any data - it is quick and while it adds some overhead, there are definitely more pros of this method than cons. The main problem with backing up MySQL using the snapshot is consistency - taking a snapshot on the server is comparable to a forced power off. If you run your MySQL server in full durability mode, you should be just fine. If not, it is possible that some of the transactions won’t make it to disk and, as a result, you will lose data. Of course, there are ways of dealing with this issue. First of all, you can change durability settings to more durable (SET GLOBAL innodb_flush_log_at_trx_commit=1, SET GLOBAL sync_binlog=1) prior to the snapshot and then revert back to the original settings after a snapshot has been started. This is the least impacting way of making sure your snapshot is consistent. Another method include stopping a slave (if the replication is the only means of modifying data on a given host) and then run FLUSH TABLES. You can also stop the activity by using FLUSH TABLES WITH READ LOCK to get a consistent state of the database. What is important to keep in mind, though, is that no matter which approach you take, you will end up with data in “crashed” state - if you’d like to use this data to create a new MySQL server, at the first start MySQL will have to perform recovery procedures on InnoDB tables. InnoDB recovery, on the other hand, may take a while, hours even - depending on the amount of modifications.

One way to go around this problem is to take cold backups. As they involve stopping MySQL before taking a snapshot, you can be sure that data is consistent and it’s all just a matter of starting MySQL to get a new server up. No recovery is needed because data came from a server which did a clean shutdown. Of course, stopping MySQL servers is not an ideal way to handle backups but sometimes it is feasible. For example, maybe you have a slave dedicated to ad-hoc queries, executed manually, which does not have to be up all the time? You could use such a server also as a backup host, shutting down MySQL from time to time in order to take a clean snapshot of its data.

As we discussed above, getting a consistent snapshot may be tricky at times. On the pro side, snapshots are a great way of provisioning new instances. This is true especially in the cloud, where you can easily create a new node using a few clicks or API calls. That it’s all true as long as you use a single volume for your data directory. Until recently, to get a decent I/O performance in EC2, the only option was to use multiple EBS volumes and setup a RAID0 over them. It was caused by a limit of how many pIOPS a single EBS instance may have. This limit has increased significantly (to 20k pIOPS), but even now there are still reasons to use RAIDed approach. In such a setup, you can’t just take snapshots and hope for the best - such snapshots will be inconsistent on RAID level, not to mention MySQL level. Cold backup will still work, as MySQL is down and no disk activity should happen (as long as MySQL data directory is located on a separate device). For more “hot” approaches, you may want to look at ec2-consistent-snapshot - a tool that gives you some options how to perform a consistent snapshot of a RAIDed volume with several EBSes under the hood. It can help you to automate some MySQL tasks like stopping a slave and running FLUSH TABLES WITH READ LOCK. It can also freeze the filesystem on operating system level. ec2-consistent-snapshot is tricky to setup and needs detailed tests, but it is one of the options to pick from.

Good practices and guidelines

We covered some ways in which you can take a backup of the MySQL database. It is time to put it together and discuss how you could setup an efficient backup process.

The main problem is that all of the backup methods have their pros and cons. They also have their requirements when it comes to how they affect regular workloads. As usual, how you’d like to make backups depends on the business requirements, environment and resources. We’d still like to share some guidelines with you.

First of all, you want to have an ability to perform point-in-time recovery. It means that you have to copy binary logs along your backup. It can be either copy from disk to disk or EBS snapshot of a volume where binlogs are located - you have to have them available.

Second - you probably want to have an ability to restore single rows. Now, everything depends on your environment. One way would be to take a logical backup of your system but it may be hard to execute on a large data set. On the other hand, if you can restore a database from the physical backup (for example, click to create a new EBS volume out of the snapshot, click to create a new EC2 instance, click to attach EBS to it), you could be just fine with this process and you won’t have to worry about the logical backup at all.

For larger databases you will be forced to use one of the physical backup methods because of the time needed to perform logical one. Next question - how often do you want to perform a backup? You have binary logs so, theoretically speaking, it should be just fine to get a backup once per day and restore the rest of the data from binlogs. In real world, though, replaying binlogs is a slow and painful process. Of course, your mileage may wary - it all depends on the amount of modifications to the database. So, you need to test it - how quickly you can process and replay binary logs in your environment? How it looks like compared to your business requirements which determines maximum allowed downtime? If you use snapshots - how long the recovery process takes? Or, if you use a cold backup approach, how often can you stop your MySQL and take a snapshot? Even on a dedicated instance, you can’t really do it more often than once per 15 - 30 minutes, workload and traffic permitting. Remember, cold backup = replication lag, no matter if you use regular replication or Galera Cluster (in Galera it’s just called differently - node is in Desync state and applying missing writesets after IST). The backup node has to be able to catch up between backups.

Xtrabackup is a great tool for taking backups - using its incremental backup feature, you can easily take deltas every five minutes or so. On the other hand, restoring those increments may take long time and is error-prone - there is a bunch of not yet discovered bugs in both xtrabackup and InnoDB which sometimes corrupts backups and render them useless. If one of the incremental backups is corrupted, the rest will not be usable. This leads us to another important point - how good is the backup data?

You have to test your backups. We mentioned it in a previous post - as a part of the healthcheck you should be checking if the backup, whichever method you choose to use, looks sane. Looking at file sizes is not enough though. From time to time, for example on monthly basis (but again, it depends on your business requirements), you should perform a full restore test - get a test server, install MySQL, restore data from the backup, test that you can join the Galera cluster or slave it off the master. Having backups is not enough - you need to ensure you have working backups.

We hope this introduction to MySQL backup methods will help you find your own solution in safeguarding your data. The main thing to keep in mind is that you should not be afraid of testing - if you don’t know whether your backup process design makes sense, do test it. As long as you have a working backup process that fulfills your organization’s requirements, there is no bad way of designing it. Just remember to test the restore from time to time and ensure you still can restore the database in a timely manner - databases change, their content too. Usually it grows. What was acceptable one year ago may not be acceptable today - you also need to take that under consideration.

Related Resources

Blog category:

Become a MySQL DBA blog series - Database High Availability

$
0
0

There are many many approaches to MySQL high availability - from traditional, loosely-coupled database setups based on asynchronous replication to more modern, tightly-coupled architectures based on synchronous replication. These offer varying degrees of protection, and DBAs almost always have to choose a tradeoff between high-availability and cost. 

This is the third installment in the ‘Become a MySQL DBA’ series, and discusses the pros and cons of different approaches to high availability in MySQL. Our previous posts in the DBA series include Backup and Restore and Monitoring & Trending.

High Availability - what does it mean?

Availability is somewhat self-explanatory. If your database can be queried by your application, it is available. High, on the other hand, is a separate story. For some organizations, ‘high’ means max several minutes of downtime over the year. For others, it might mean a few hours per month. If you’ve read the previous blogs in this series, you may have noticed a pattern - “it depends on the business requirements”. This applies here also - you need to know your requirements in terms of how long downtime you can accept as it may limit your HA options significantly. What you need to keep in mind is that the length of a database incident, that causes some disturbance in database access, may be related to the HA method you choose. On the other hand, whether this disturbance affects end users is a different thing. For starters - does your application use a cache? How often does it need to be refreshed? Is it acceptable for your application to show stale data for some period of time? And for how long?

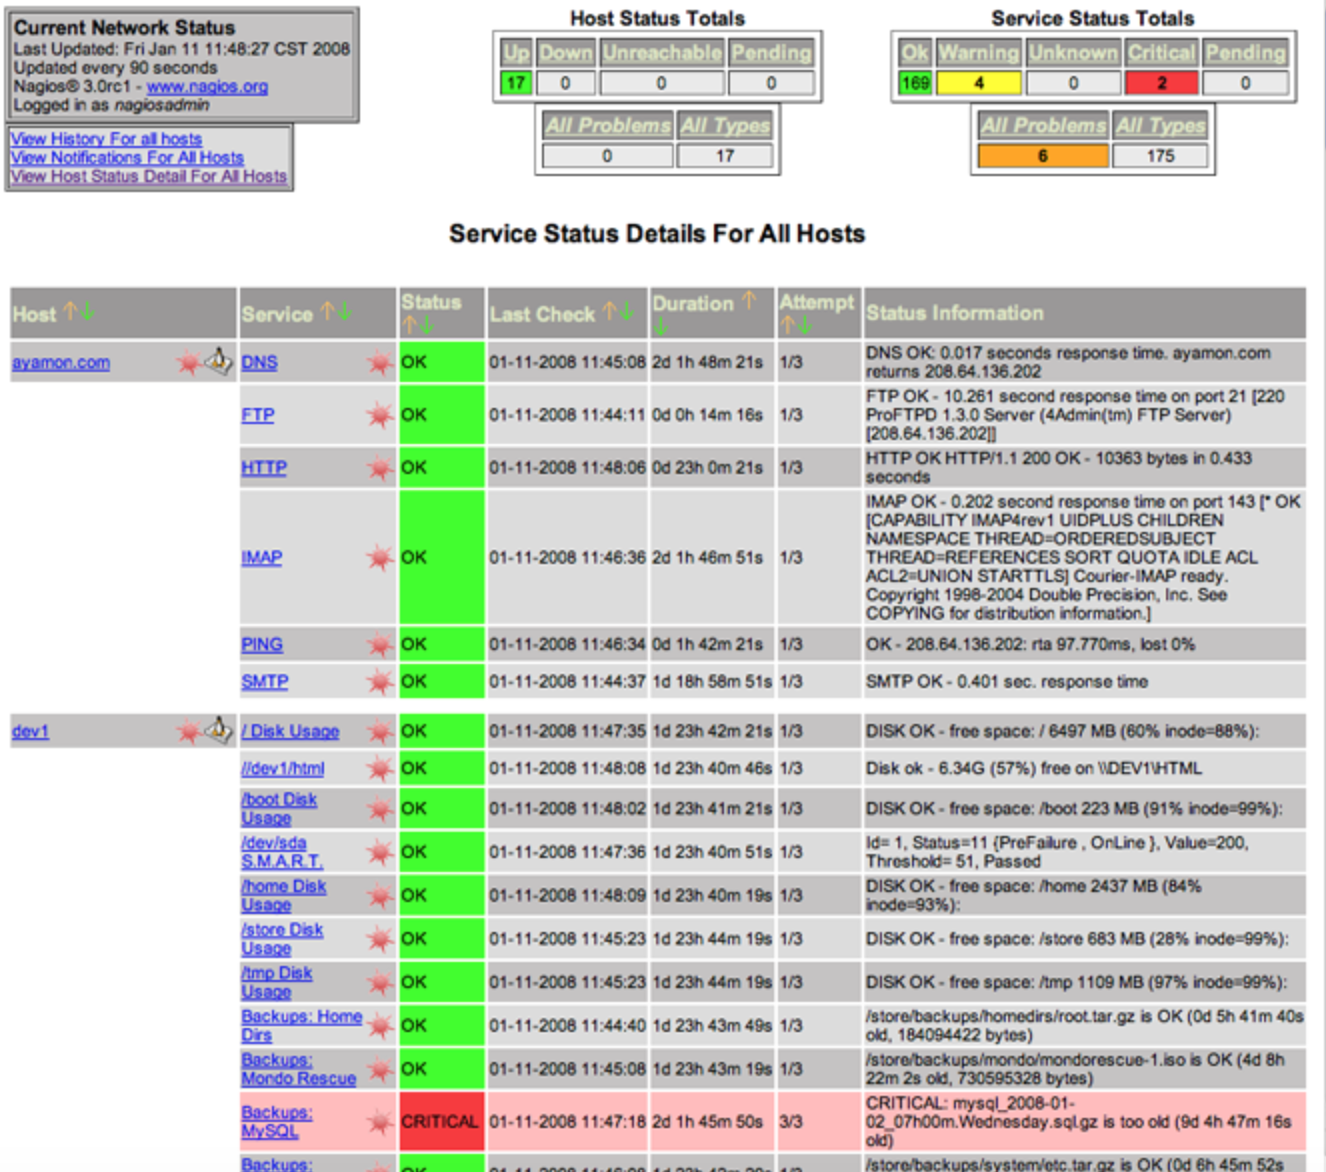
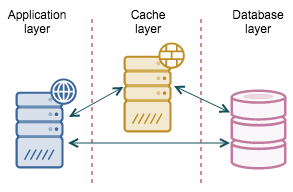
Caching Layer - for database reads and writes?

A cache that sits between the application and the database might be a way of decoupling those two from each other. 

For reads you can use one of many cache solutions - memcached, Redis, couchbase. Cache refresh can be performed by a background thread which, when needed, gets the data out of MySQL and stores it in the caching layer. It could be that the data is outdated because the database is not reachable and the background thread is not able to refresh the cache. While the database is down, the application serves the data out of cache - as long as it’s ok to serve stale data for some time, you are just fine and users may not even experience any issues. 

With writes, it is a similar story - you may want to cache writes in a queue. In the background, you would have threads that read the data out of the queue and store them into the database. Ideally those background threads keep the queue empty and any write request is handled immediately. If the database is down, the queue can serve as a write buffer - the application can still make modifications to the data but the results are not immediately stored in the database - they will be later on, when the database gets back online and the background threads start working on the backlog.

There are many ways to keep users happy and unaware of the issues behind the scenes - all user-related modifications can be immediately presented to the user, to give an impression that everything is just fine. Other users will not see those changes until the write queue is flushed to the database. Of course, it depends on what kind of data we are talking about - in many cases (e.g., social media site, web forum, chat engine, comment engine), it might be just fine. One way or another, this “illusion” can be maintained only for some period of time though. Eventually, the database has to be brought up again. Let’s talk now about our options for database high availability.

Block-level replication (DRBD)

We’ll start with DRBD - Distributed Replicated Block Device. In short, imagine that you could create a RAID1 over the network. This is, more or less, what DRBD does. You have two nodes (or three in the latest versions), each of them have a block device dedicated to storing data. One of them is in active mode, mounted and basically works as a database server. The rest of them are in passive standby mode - any changes made on the active node’s block device are replicated to the passive nodes and applied. Replication can be synchronous, asynchronous or memory synchronous. The point of this exercise is that, should the active node fail, the passive nodes have an exact copy of the data (if you use replication in synchronous mode, that is). You can then promote a passive node to active, mount the block volume, start the services you want (like, MySQL for example), and you have a replacement node up and running.

There are couple of disadvantages in the DRBD setup. One of them is the active - passive approach. It’s a problem on multiple layers. For starters, you have to have two nodes while you can use only one of them. You cannot use the passive node for ad-hoc or reporting queries, you cannot take backups off it. Additionally, fail-over equals to starting a crashed MySQL (like someone just pulled the power plug) - InnoDB recovery will kick in and while data may not be lost (subject to InnoDB’s durability settings), the process may take significant amount of time, workload depending. Once the node is up, it willl need some time to warm up - you can’t prewarm it as it is not active. Last but not least, we are talking about 1:1 or 1:2 setups - only one active node and one or two copies. Theoretically you could use DRBD to keep a copy of master -> slave setup but we haven’t seen it in production nor it makes sense from a cost point of view.
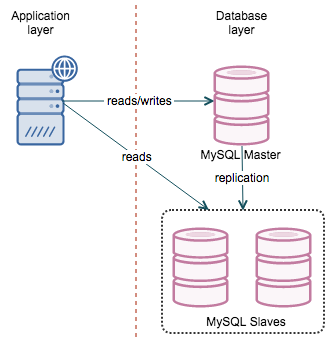
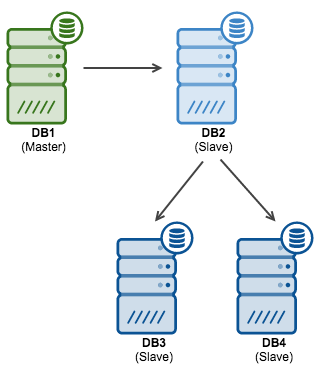
MySQL replication

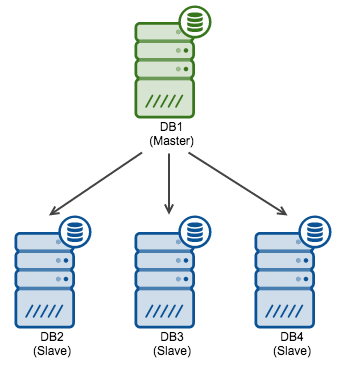
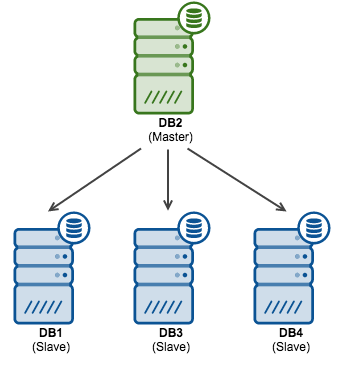
MySQL replication is one of the oldest and probably the most popular way of achieving MySQL high availability. The concept is simple - you have a master that replicates to one or more slaves. If a slave goes down, you use another slave. If the master is down, you promote one of the slaves to act as a new master. When you get into details, though, things become more complex.

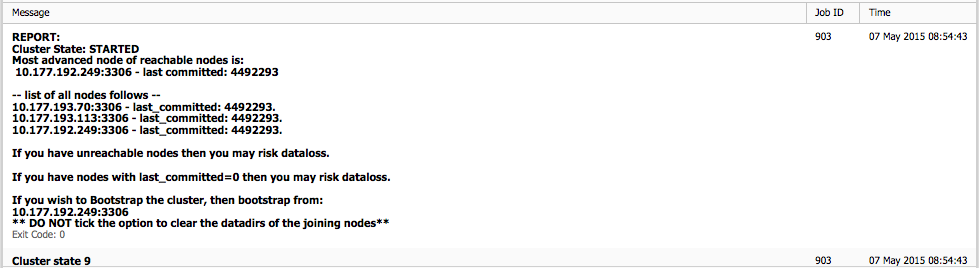
Master failover consists of several phases:

  1. You need to locate the most advanced slave
  2. If there are more of them, pick one as a new master and reslave the rest to the new master
  3. If there is only one “most advanced” slave, you should try to identify missing transactions and replay them on the rest of the slaves to get them in sync
  4. If #3 is not possible, you’ll have to rebuild slaves from scratch, using the data from the new master
  5. Perform the switch (change proxy configuration, move virtual IP, anything you need to move the traffic to the new master)

This is a cumbersome process and while it’s possible to manually perform all the steps, its very easy to make mistakes. There are options to automate it, though. One of the best solutions is MHA - a tool which handles the failover, forced or planned, it doesn’t matter. It is designed to find a slave that is the most up to date compared with the master. It will also try to apply any missing transactions to this slave (if the binary logs on the master are available). Finally, it should reslave all of the slaves, wherever possible, to the new master. MMM is another solution that performs failover, although this might not work well for some users

Along with MySQL 5.6, Oracle introduced Global Transaction Identifiers and this opened a whole new world for HA possibilities in MySQL replication. For starters, you can easily reslave any slave to any master - something which had not been possible with regular replication. There is no need to check binlog positions, all you need to know is CHANGE MASTER TO … MASTER_AUTO_POSITION=1; Even though the reslaving part is easy, you still have to keep an eye on the slave’s status and determine which one will be the best candidate for a master. Regarding tooling: MHA can be used in GTID replication in a similar way as with regular replication. In addition, in such setup it is possible to use binlog servers as a source of missing transactions. Oracle also created a tool - mysqlfailover which performs periodical or constant health checks for the system and has support for both automated and user-initiated failover.

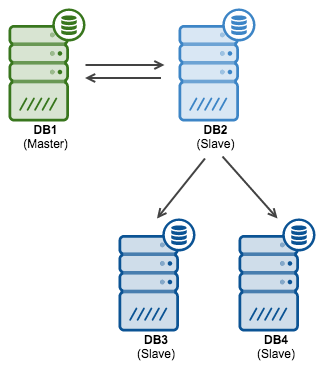
The main issue with standard MySQL replication is that by default it is asynchronous which means, in short, that in the event of master’s crash, it is possible that not all transactions were replicated to at least one of the slaves. If a master is not accessible (so tools like MHA can’t parse its binlogs to extract missing data), it means that this data is lost. To eliminate this problem, semi-sync replication was added to MySQL. It ensures that at least one of the slaves got the transaction and wrote it in its relay logs. It may be lagging but the data is there. Therefore, if you use MySQL replication, you may consider setting up one of your slaves as a semi-sync slave. This is not without impact, though - commits will be slower since the master needs to wait for the semi-sync slave to log the transactions. Still, its something that you may want to consider - it is possible that for your workload it won’t make a visible difference. By default, ClusterControl works in this mode with MySQL replication. If you are using GTID-based failover, you should also be aware of Errant Transactions.

Clustering

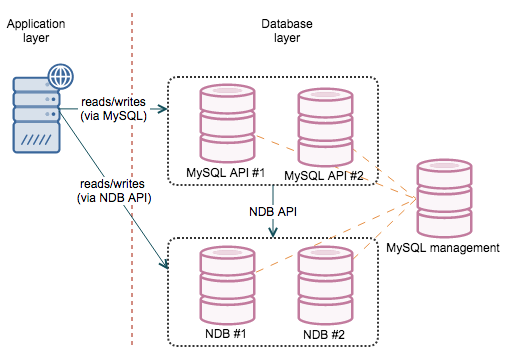
The ultimate solution to HA is to use a synchronous (or at least “virtually” synchronous) cluster. This leads us to MySQL Cluster and Galera (in all it’s flavors).

MySQL Cluster is based on the NDB engine and delivers great point-select performance or inserts. It provides internal redundancy for the data as well as in connectivity layer. This is one of the best solutions, as long as it is feasible to use in your particular case. This is also its main issue - it is not your regular MySQL/InnoDB and behaves differently. The way it stores data (partitioned across multiple data nodes) makes some of the queries much more expensive as there is quite a bit of network activity needed to grab the data and prepare a result. More information in our MySQL Cluster training slides

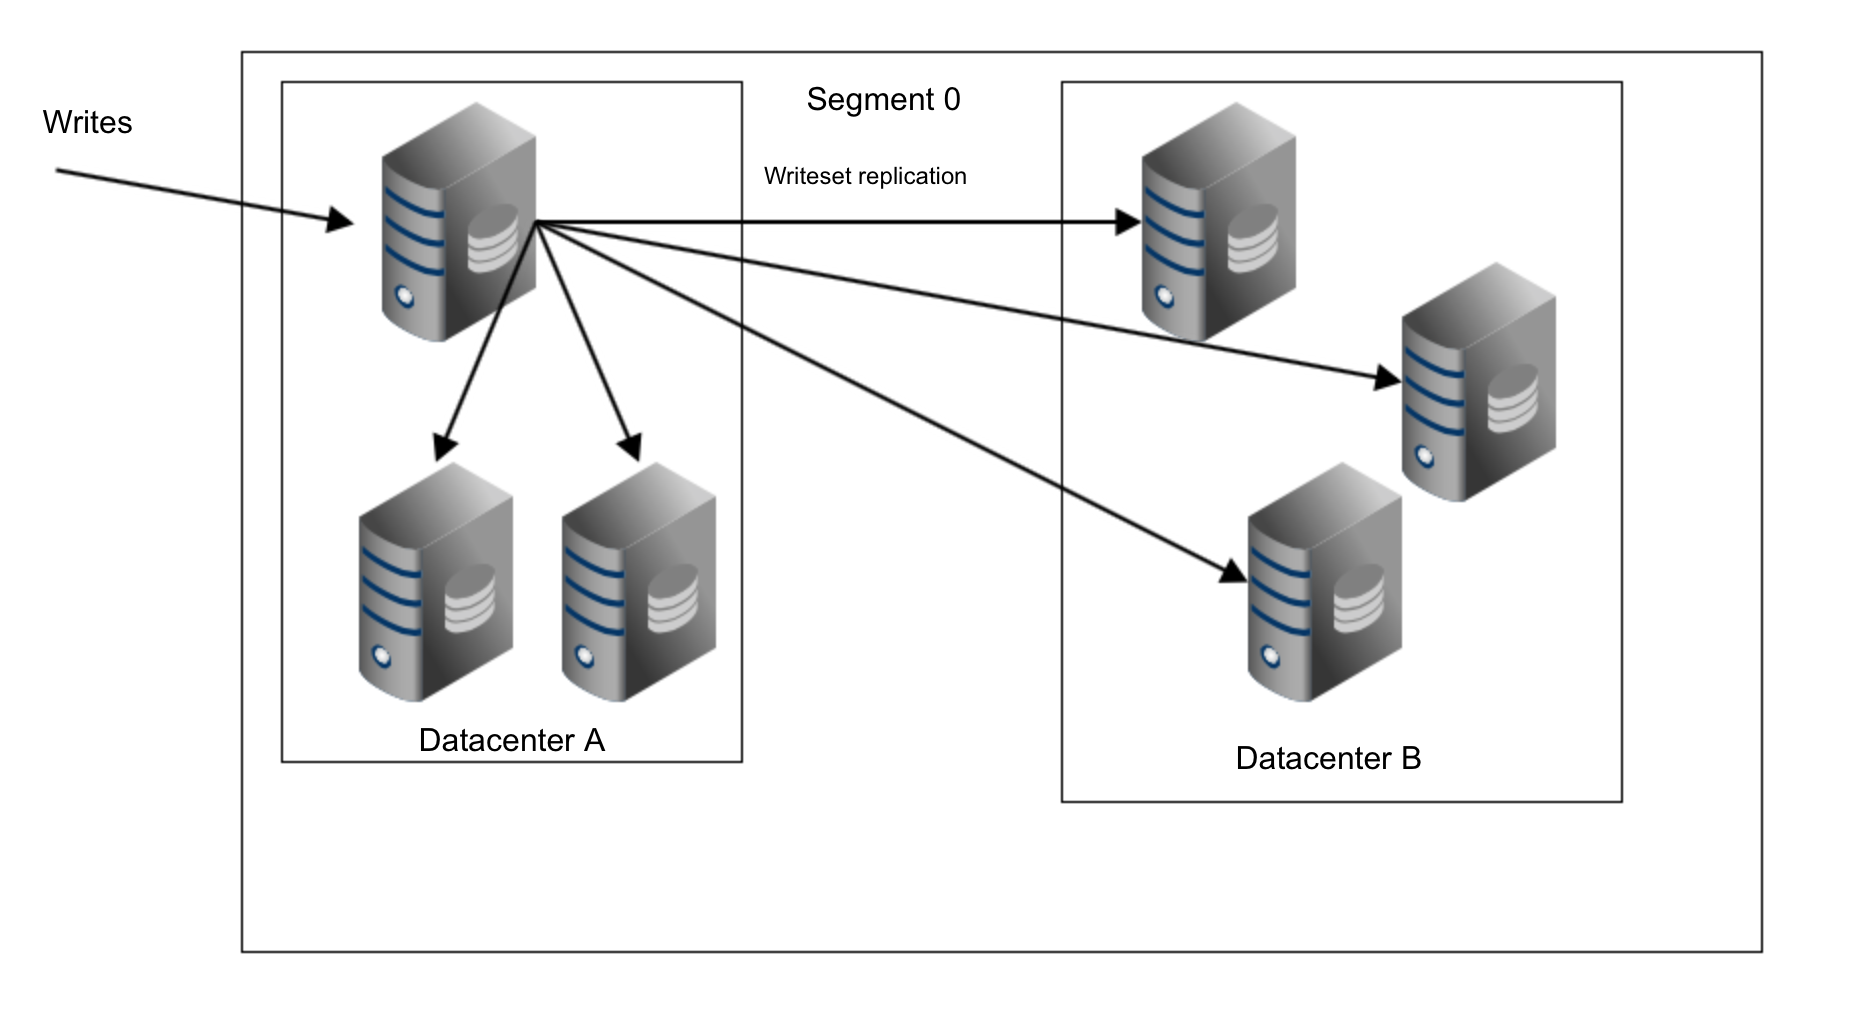
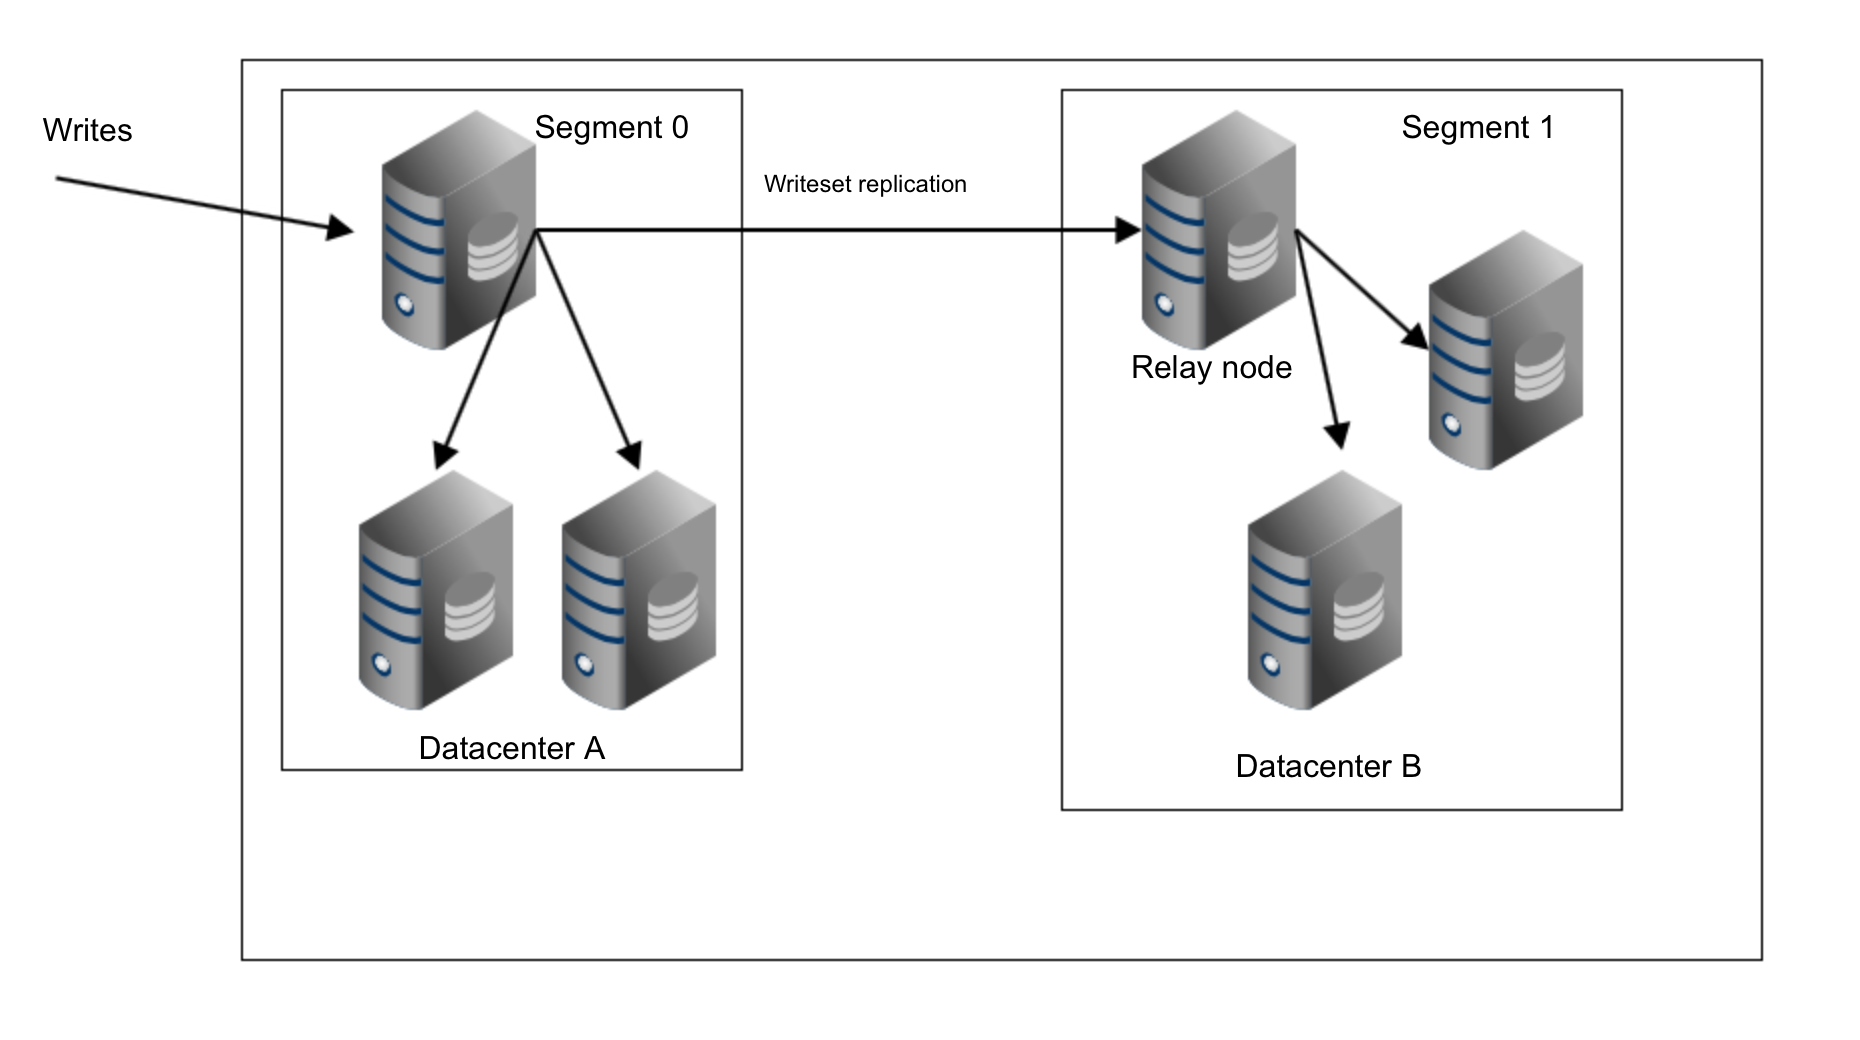
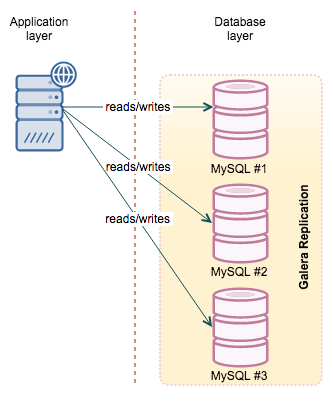
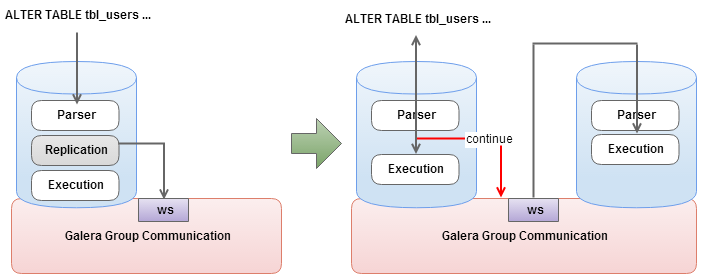
Galera, be it Codership’s vanilla version, MariaDB Cluster or Percona XtraDB Cluster, much closer resembles MySQL with InnoDB. Actually, it does use InnoDB as storage engine. There are a couple of things to keep an eye on (very big transactions, DDL’s) but for most of the cases, it is the same MySQL/InnoDB that we are used to. Galera does not split the data, it uses multiple nodes, each has a full copy of the dataset - similar concept to the master/slave. The main difference is that the replication protocol is “virtually” synchronous which means that the data is almost immediately available across the cluster - there is no slave lag. Another important aspect, when comparing Galera to NDB cluster, is the fact that every node has a full dataset available. It makes it harder to scale (you can’t add more nodes to add more data capacity of the cluster) but on the other hand, it is easier to run all kind of queries, reporting included - no need to move the data across the network. More information on this online tutorial for Galera Cluster

Both clusters, practically speaking (there are some exceptions on both sides), work as a single instance. Therefore it is not important which node you connect to as long as you get connected - you can read and write from any node.

From those options, Galera is a more likely choice for the common user - its workload patterns are mostly close to the standalone MySQL, maintenance is also somewhat similar to what users are used to do. This is one of the biggest advantages of using Galera. MySQL Cluster (NDB) may be a great fit for your needs but you have to do some testing to ensure its indeed the case. This webinar discusses the differences between Galera and NDB

Proxy layer

Having MySQL setup one way or another is not enough to achieve high availability. Next step would be to solve another problem - how should I connect to the database layer so I’ll always connect to hosts which are up and available?

Here, a proxy layer can be very useful. There are couple of options to pick from.
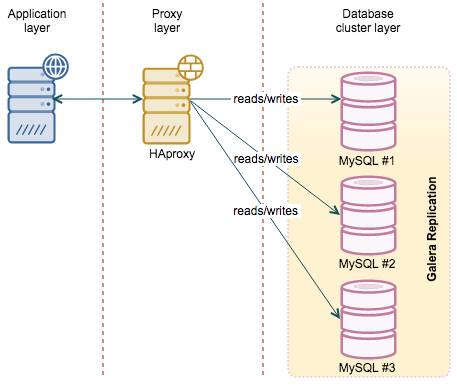
HAProxy

HAProxy is probably the most popular software proxy out there, at least in MySQL world. It is fast, easy to configure and there are numerous howto’s and config snippets in the Internet which makes it easy to set it up. On the other hand, HAProxy does not have any sophisticated database logic and is not aware of what’s going on in MySQL or Galera Cluster. It can check MySQL’s port but that’s all - it’s either up or down. It can be a serious problem for both regular replication and setups based on Galera Cluster.

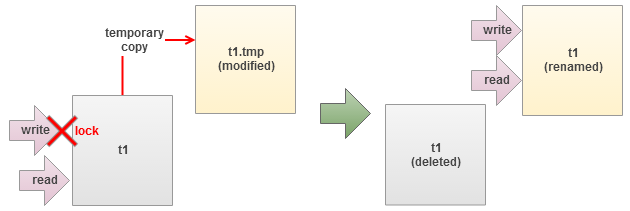
Regular replication has two types of hosts - master, serving reads and writes, and read-only slaves. If we set up an automated failover using, for example, MHA, it may happen that the master is no longer a master and one of the slaves is no longer a slave. Proxy configuration has to be changed, ideally - dynamically. Galera cluster, on the other hand, has nodes which may be in various states. A node can be a donor, serving data to the joining node. A node can be joining the cluster. A node also can be desynced manually (for example, during the time you’re taking a backup). Finally, a node can be in non-Primary state. It is not a 0/1 situation - we may want to avoid nodes which are in the donor state as they do significant amount of I/O and it can cause impact to production. We also do not want to use joining nodes as they most likely are not up to date in terms of executed writesets. More details can be found in this webinar on HAProxy

HAProxy, out of the box, do not have any options to handle such cases. It has a feature which we may utilize to enhance its abilities - HTTP check. Basically, instead of checking if a given port is open or close, HAProxy may do a HTTP connection to a given port. It it receives 200 code, it assumes that the service is up. Any other code, let’s say 503 (which is pretty popular in scripts) will trigger ‘service down’ state. This, along with xinetd and a simple (or more complex) script allows a DBA to implement more complex logic behind the scenes. The script may check the MySQL replication topology and return the correct error code depending on whether a host is a slave or not, depending on which backend is used (usually we define one backend for a master and one for all slaves, as described here). For Galera, it may check the node’s state and, based on some logic, decide if it’s ok to serve reads from the node or not.
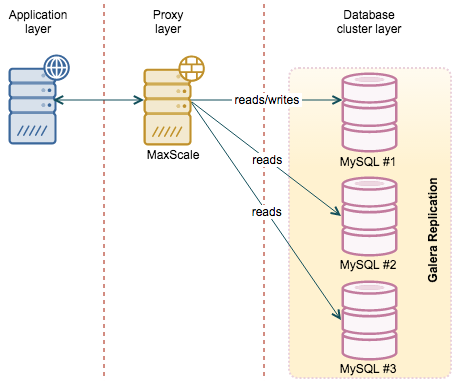
MaxScale

One of the latest additions to the MySQL ecosystem is MaxScale, a proxy developed by MariaDB Corporation. The main difference over HAProxy is that MaxScale is database-aware. It was designed to work with MySQL and it gives a DBA more flexibility. It also has a significant number of features, in addition to being a proxy. For example, should you need a binlog server, MaxScale may help you here. From an HA point of view though, the most important feature is its ability to understand MySQL states. If you use regular replication, MaxScale will be able to determine which node is the master and which one is a slave. In case of failover, this makes one less config change to keep in mind. In case of Galera Cluster, MaxScale has the ability to understand which node is joined and which is not. This helps to keep traffic away from nodes which are, for example, receiving incremental state transfer. If you have Galera, MaxScale also picks up one of the nodes as a “master” even though there is no “master” in a sense of normal replication. It is still very useful - in case you’d like to perform a read/write split (to avoid deadlocks, for example), you can rely on the proxy to direct your writes to a single node in the cluster while the reads will hit the other nodes. We previously blogged about how to deploy/configure MaxScale.  

There are also some issues with MaxScale that you need to be aware of. Even though it is GA, it is relatively new software. Therefore detailed tests should be carried out to check if the features that you will rely upon do work as advertised. Another problem, somehow connected, is that MaxScale uses quite a bit of CPU. It is understandable as some of the features require processing power, but it may be a limitation for environments with larger traffic. We assume that eventually, this will be optimized but for now, this is something you need to keep in mind. You might want to check out performance benchmark MaxScale vs HAProxy.

HA for proxies

So, here we are, our database and proxy layers are up and running. Proxies are configured to split the workload across the database layer, ensuring that traffic is served even if some of the  database instances are down. Next problem to solve is - what happens if your proxy goes down? How do you route traffic to your databases?

If you use Amazon Web Services, Elastic Load Balancer (ELB) is a great tool to solve this problem. All you need to do is to set it up with proxy nodes as backend and you are all good. Under the hood AWS will create several ELB instances that will be highly available and will route the traffic to those proxy nodes which are up.

If you do not use AWS, you may need to develop some other method. One of them could be to have a virtual IP assigned to one of the proxy instances. If the instance is down, the IP will be moved to another proxy. Keepalived is one of the tools that could provide this kind of functionality, but there are others as well. One of the advantages of this setup is that you only have two proxy nodes on which you need to introduce configuration changes (as compared to a number of instances, as described in the next paragraph). Two nodes is the minimal requirement for HA. The disadvantage is that only one of them will be up at any given time - this could be a limitation if the workload is high.

Another approach could be to collocate proxy servers on application servers. Then you can configure the application to connect to the database nodes using a proxy installed on localhost. The reasoning behind it is that by sharing hardware we minimize the chance that the proxy will be down while application server will be up. It is more probable that both services will be either up or down and if a given application instance works, it will be able to connect to the proxy. The main advantage of this setup is that we have multiple proxy nodes, which helps to scale. On the other hand, it is more cumbersome to maintain - any configuration changes have to be introduced on every node.

Do we need a proxy layer?

While a proxy layer is useful, it is not required. It’s especially true if we are talking about Galera Cluster. In such case you can as well read and write to any of the nodes and if a given node doesn’t respond, you can just skip it and move the next one. You may encounter issues with deadlocks but as long as you are ok with it (or you can work around them), there’s no need to add additional complexity. If you’d like to perform an automated failover in MySQL replication, things are different - you have a single point where you can write - a master. One of possibilities is to use a virtual IP as a point where the application can write. Then you can move it from host to host, following the replication chain changes, ensuring that it always points to the current master.

Split-brain scenarios

There are cases where issues in communication between data replicas may lead to two separate data sets, each one randomly serving applications without coordinating with the other one.

Let’s take a look at the simplest example - one master, two slaves, VIP pointing to the master, automated failover. 

  • Master loses network connection
  • Failover is deemed as needed 
  • one of the slaves is staged to be a new master
  • the other slave is reslaved
  • VIP is assigned to the new master.

So far so good. There’s a ticking bomb hidden in the basement, though. The old master lost the network connection - this was main reason for the failover, but it also means that it was not possible to connect to it and take down the VIP. If its connection recovers, you’ll end up with two hosts having the same VIP. For a while at least, as you would probably have some scripts to detect such a situation and take down VIP on the old master. During this short time, some of the writes will hit the old master creating a data mismatch.

It’s hard to get protected against such situation. What you want to do is to have a STONITH implemented (Shoot The Other Node In The Head, one of the nicest acronyms in IT). Basically, you want to ensure that after a successful failover, the former master is down as in “down and will never come back up”. There are numerous ways to achieve this and it mostly depends on your environment. Barebone servers are more flexible here.

You may want to use a separate network to form a “backup” link - one switch, couple of patchcords. Something disconnected from main network, routers etc. You can use such a connection to check the health of the other node - maybe it’s just a primary network that failed? Such dedicated connection can also be used for a IPMI or some other KVM-ish access. Maybe you have access to the manageable power strip and you can turn off a power outlet? There are many ways to shutdown the server remotely if you are in the datacenter. In a cloud environment, things are different but the least you could do is to utilize different NIC’s and create a bonded interface (keeping fingers crossed that, behind the scenes, they do not use exactly the same hardware). If using AWS, you can also try and stop the node using the EC2 CLI.

We are aware that this topic is more suitable for a book than a mere blog post. High Availability in MySQL is a complex topic which requires plentiful of research and depends heavily on the environment that you use. We’ve tried to cover some of the main aspects, but do not hesitate to hit the comment button and let us know your thoughts.

Blog category:

Become a MySQL DBA - webinar series: deciding on a relevant backup solution

$
0
0

Backup and restore is one of the most important aspects of database administration. If a database crashed and there was no way to recover it, any resulting data loss might lead to devastating results to a business. As the DBA operating a MySQL or Galera cluster in production, you need to ensure your backups are scheduled, executed and regularly tested.

There are multiple ways to take backups, but which method fits your specific needs? How do I implement point in time recovery? 

Join us for this live session on backup strategies for MySQL and Galera clusters led by Krzysztof Książek, Senior Support Engineer at Severalnines.

DATE & TIME

Europe/MEA/APAC
Tuesday, July 30th at 09:00 BST / 10:00 CEST (Germany, France, Sweden)
Register Now

North America/LatAm
Tuesday, July 30th at 09:00 Pacific Time (US) / 12:00 Eastern Time (US)
Register Now

AGENDA

  • Logical and Physical Backup methods
  • Tools
    • mysqldump
    • mydumper
    • xtrabackup
    • snapshots
  • How backups are done in ClusterControl
  • Best practices
  • Example Setups
    • On premises / private datacenter
    • Amazon Web Services

SPEAKER

Krzysztof Książek, Senior Support Engineer at Severalnines, is a MySQL DBA with experience in managing complex database environments for companies like Zendesk, Chegg, Pinterest and Flipboard. 

This webinar ‘Become a MySQL DBA - deciding on a relevant backup solution’ will show you the pros and cons of different backup options and help you pick one that goes well with your environment.

We look forward to “seeing” you there and to insightful discussions!

restore_logo.png

Blog category:

Become a MySQL DBA blog series - Common operations - Schema Changes

$
0
0

Database schema changes are not popular among DBAs, not when you are operating production databases and cannot afford to switch off the service during a maintenance window. These are unfortunately frequent and necessary, especially when introducing new features to existing applications. 

Schema changes can be performed in different ways, with tradeoffs such as complexity versus performance or availability. For instance, some methods would trigger a full table rewrite which could lead to high server load. This in turn would lead to degraded performance and increased replication lag in master-slave replication setups. 

This is the fourth installment in the ‘Become a MySQL DBA’ series, and discusses the different approaches to schema changes in MySQL. Our previous posts in the DBA series include High Availability, Backup & Restore and Monitoring & Trending.

Schema changes in MySQL

A common obstacle when introducing new features to your application is making a MySQL schema change in production, in the form of additional columns or indexes. Traditionally, a schema change in MySQL was a blocking operation - a table had to be locked for the duration of the ALTER. This is unacceptable for many applications - you can’t just stop receiving writes as this causes your application to become unresponsive. In general, “maintenance breaks” are not popular - databases have to be up and running most of the time. The good news is that there are ways to make this an online process. 

Rolling schema update in MySQL Replication setups

MySQL replication is an easy way of setting up high availability, but managing schema updates are tricky. Some ALTERs may lock writes on the master and create replication lag - this is obvious for any ALTER statement. The reason is simple - MySQL replication is single-threaded and if the SQL thread is executing an ALTER statement, it won’t execute anything else. It is also important to understand that the slave is able to start replicating the schema change only after it has completed on the master. This results in a significant amount of time needed to complete changes on the slave: time needed for a change on the master + time needed for a change on the slave.

All of this sounds bad but replication can be used to help a DBA manage some of the schema changes. The plan is simple - take one of the slaves out of rotation, execute ALTERs, bring it back, rinse and repeat until all slaves have been updated. Once that’s done, promote one of the slaves to master, run ALTER on the old master, bring it back as a slave.

This is a simple yet efficient way of implementing schema changes. Failover requires some downtime but it is much less impacting than running all of the changes through the replication chain, starting from the master. The main limitation of this method is that the new schema has to be compatible with the current schema - remember, master (where all writes happen) has it unchanged until almost the end. This is a significant limitation, especially if you use row-based binary log format. While statement-based replication (SBR) is pretty flexible, row-based replication (RBR) is much more demanding when it comes to the schema consistency. For example, adding a new column in any place other than the end of the table won’t work in RBR. With SBR, it is not an issue. Be sure you checked the documentation and verified that your schema change is compatible. Last but not least, if you use mixed binlog format, keep in mind that while it uses mostly statement-based binlog format, it will use row-based binlog format for those queries which are not deterministic. Thus, it may cause similar problems as RBR.

MySQL-based functionality for online schema change

As we mentioned earlier, some of the operations may not be blocking in MySQL and thus can be executed on a live system. It is true especially with MySQL 5.6, which brought a number of improvements in this area. Unfortunately, it doesn’t solve problems with replication lag - ALTERs will still cause this type of problem. Still, this is a great choice for smaller tables where lag created is acceptable. Of course, it is application-dependent but usually it’s not a big deal if the slave lag is a couple of seconds and this may mean that tables even up to a couple of gigabytes (hardware-dependent) may be within range. If your application cannot accept even such small lag, then we’d strongly suggest to rethink about the design. Slaves will lag, it is just a matter of when it will happen.

Other tools for Online schema change

There are a couple of tools that perform online schema change in MySQL. The best known is probably pt-online-schema-change, which is part of Percona Toolkit. Another one is “Online Schema Change” developed by Facebook.

  • Those tools work in a similar way
  • create a new table with the desired schema;
  • create triggers on the old table that will mirror all changes and store them in the new table;
  • copy data from old table into a new one in batches;
  • once it’s done, rename tables and drop the old one.

Those tools give the DBA great flexibility - you don’t have to do a time-consuming rolling upgrade, it’s enough to run pt-online-schema-change and it will take care of your ALTER. It’s even replication-aware and, as such, it can throttle itself down when a lag is detected on one of the slaves. It’s not without limitations, though. 

You need to be aware that the “copy” operation is basically a number of low priority inserts. They will impact the overall performance - it’s inevitable. The process of moving millions of rows takes time - online schema change is much slower than the direct ALTER executed on the same table. By “much” we mean even an order of magnitude. Of course, it all depends on your hardware (disk throughput is the most important factor) and table schema, but it is not uncommon to see changes which literally take days to finish. Another limitation is the fact that this tool cannot be used on a table where triggers already exist. For now MySQL allows only a single trigger of a given type per table. This will probably change in MySQL 5.7 (the relevant worklog is marked as completed) but it doesn’t help much if you run on MySQL 5.6. 

Another problem is with foreign keys - they are linked to a given table and if you create a new one and then swap it with the old table, foreign keys will have to be updated to point to the new table. Pt-online-schema-change gives you two options to deal with it but, frankly, none of them is good. 

The first option, fast but risky, is to drop the old table instead of renaming it. The main problem here is two-fold - first, for a while there’s no table - renaming a table is an atomic operation, dropping it is not. Second, as the old table has been dropped, there’s no rollback if an error occurs after the drop. 

The second option requires executing ALTERs on the tables linked by foreign keys - those tables are basically altered and new FKs are created. This is fine as long as those tables are small because the change is executed as a normal ALTER with all it’s consequences (replication lag, for example).

Metadata locking is another problem that you may experience while using pt-online-schema-change. Pt-osc have to create triggers and this operation requires a metadata lock. On a busy server with plenty of long-running transactions, this could be hard to acquire. It is possible to increase timeouts and, in that way, increase chances of acquiring the lock. But we’ve seen servers where it’s virtually impossible to run pt-online-schema-change due to this problem. 

Given this long list of the problems and limitations, you might think that this tool is not worth your time. Well, on the contrary. The list is so long because almost every MySQL DBA will rely on pt-online-schema-change heavily and, in the process, will learn all of it’s dark sides. This tool is one of the most useful tools in the DBA’s toolkit. Even though it has some limitations, it gives you great degree of flexibility regarding how to approach schema changes in MySQL.

Schema changes in Galera Cluster

Galera cluster brings another layer of complexity when it comes to schema changes. As it is a ‘virtually’ synchronous cluster, having a consistent schema is even more important than regular MySQL connected via replication. Galera brings two methods of running schema changes and we’ll discuss them and the repercussions of using them below.

TOI (Total Order Isolation)

The default one, TOI - Total Order Isolation, works in a way that the change happens at exactly the same time on all of the nodes in the cluster. This is great for consistency and allows you to run any kind of change, even non-compatible ones. But it comes with a huge cost - all other writes have to wait until the ALTER finishes. This, of course, make long-running ALTERs not feasible to execute because every one of them will cause significant downtime for the whole application. This mode can be used successfully for quick, small changes which do not take more than a second (unless you are ok with some ‘stalls’ in your application or you have a maintenance window defined for such changes).

What is also important is that MySQL’s online ALTERs do not help here. Even a change, which you could easily run on the master without blocking it (and only be concerned about slaves lagging) will cause all writes to halt.

RSU (Rolling Schema Upgrade)

The second option that Galera offers is RSU - Rolling Schema Upgrade. This is somewhat similar to the option we discussed above, (see section on Rolling Schema Update in MySQL Replication setups). At that time we were pulling out our slaves, one by one, and finally we executed a master change. Here we’ll be taking the Galera nodes out of rotation.

The whole process is partially automated - set the wsrep_OSU_method variable to RSU, and all you need to do is to proceed with the ALTER. The node will switch to the Desync state and flow control will be disabled ensuring that the ALTER will not affect the rest of the cluster. If your proxy layer is setup in a way that Desync state means no traffic will reach this node (and that’s how you should set up your proxy), such operation is transparent to the application. Once the ALTER finishes, the node is brought back to sync with the cluster.

This has several repercussions that you need to keep in mind. First of all, similar to the rolling schema upgrade on MySQL replication, changes have to be compatible with the old schema. As Galera uses row-based format for replication, it is very strict regarding changes that can be done online. You should verify every change you plan to make (see MySQL documentation) to ensure it is indeed compatible. If you performed an incompatible schema change, Galera won’t be able to apply writesets and it will complain about a node not being consistent with the rest of the cluster. This will result in Galera wiping out the offending node and executing SST.

You also need be aware of the fact that, for the duration of the change, the altered node does not process writesets. It will ask for them later, once it finishes the ALTER process. If it won’t find the writesets on any of the other synced nodes in the cluster, it will execute SST, removing the change completely. You have to ensure that gcache is large enough to store the data for the duration of the ALTER. It can be tricky and problematic as gcache size is only one of the factors - another one is the workload. You may have increased gcache but if the amount (and size) of the writesets in a given time increases too, you may still run out of space in the cache.

Generic scenarios of the schema change

Now, let’s look at some real life scenarios and how you could approach them. We hope this will make more clear the strong and weak points of each method. Please note that we are adding estimated time to each of these scenarios. It is critical that the DBA, before executing a change, has knowledge about the time needed to complete it. We cannot stress it enough - you have to know what you’ll be executing and how long will it take.

There are a couple of ways in which you can estimate the performance. First, you can (and you should) have a development environment with a copy of your production data. This data should be as close to the real production copy as possible in terms of the size. Sure, sometimes you have to scrub it for security reasons, but still - closer to production means better estimates. If you have such environment, you can execute a change and assess the performance.

Another way, even more precise, is to run the change on a host that is connected to the production setup via replication. It is more precise because, for example, pt-online-schema-change execute numerous inserts and they can be slowed down because of the regular traffic. Having the regular traffic flown in via replication helps to make a good assessment. 

Finally, it’s all about the experience of the DBA - knowledge about the system’s performance and workload patterns. From our experience we’d say that when in doubt, add 50% to the estimated time. In the best case, you’ll be happy. In the worst, you should be about right, maybe a bit over the ETA.

Scenario - Small table, alter takes up to 10s

MySQL Replication

In this case it’s a matter of answering the question - does your application allow some lag? If yes, and if the change is non-blocking, you can run direct ALTER. On the other hand, pt-online-schema-change shouldn’t take more than couple of minutes on such a table and it won’t cause any lag-related issues. It’s up to you to decide which approach is better. Of course, if the change is blocking on the MySQL version you have installed, online schema change is the only option.

Galera Cluster

In this case, we’d say the only feasible way of executing the change is to use pt-online-schema-change. Obviously we don’t want to use TOI as we’d be locked for couple of seconds. We could use RSU if the change is compatible, but it creates additional overhead of running the change on a node, one by one, keeping an eye on their status, ensuring the proxy layer is taking nodes out of rotation. It’s doable but if we can use online schema change and just let it run, why not do that?

Scenario - Medium-sized table, from 20 - 30 minutes up to 1h

Replication and Galera Cluster

This is where pt-online-schema-change shines. Changes take too long for a direct ALTER to be feasible yet the table is not too big and pt-osc should be able to finish the process within several hours at the most. It may take a while but it will eventually be done. It’s also much less cumbersome than executing a rolling schema upgrade.

Scenario - Large tables, more than 1h, up to 6 -12h

MySQL Replication

Such tables can become tricky ones. On the one hand, pt-online-schema-change will work fine, but problems may start to appear. As pt-osc is expected to take even 36 - 48h to finish such change, you need to consider impact on the performance (because pt-osc has its impact, the inserts need to be executed). You also need to assess if you have enough disk space. This is somewhat true for most of the methods we described (except maybe for online ALTERs) but it’s even more true for pt-osc as inserts will significantly increase the size of the binary logs. Therefore you may want to try to use Rolling Schema Upgrade - downtime will be required but the overall impact may be lower than using pt-osc.

Galera Cluster

In Galera, the situation is somewhat similar. You can also use pt-online-schema-change if you are ok with some performance impact. You may also use RSU mode and execute changes node by node. Keep in mind that gcache size for 12hrs worth of writesets, on a busy cluster, may require a significant amount of memory. What you can do is to monitor wsrep_last_committed and wsrep_local_cached_downto counters to estimate how long the gcache is able to store data in your case.

Scenario - Very large tables, more than 12h

First of all, why do you need such a large table? :-) Is it really required to have all this data in a single table? Maybe it’s possible to archive some of this data in a set of archive tables (one per year/month/week, depending on their size) and remove it from the “main” table?

If it’s not possible to decrease the size (or it’s too late as this process will take weeks while ALTER has to be executed now), you need to get creative. For MySQL Replication you’ll probably use rolling schema upgrade as a method of choice with a slight change, though. Instead of running the ALTER over and over again you may want to use xtrabackup or even snapshots, if you have LVM or run on EBS volumes in EC2, to propagate changes through the replication chain. It will be probably faster to run ALTER once and then rebuild slaves from scratch using the new data (rather than executing the ALTER on every host).

Galera Cluster may suffer from problems with gcache. If you can fit the 24h or even more data into gache, good for you - you can use RSU. If not, though, you will have to improvise. One way would be to take a backup of the cluster and use it to build a new Galera cluster which will be connected to the production one via replication. Once that is done, run the change on the ‘other’ cluster and, finally, failover to it.

As you can see, schema changes may become a serious problem to deal with. This is a good point to keep in mind that the schema design is very important in relational databases - once you push data into tables, things may become hard to change. Therefore you need to design table schemas as time-proof as possible (including indexing any access pattern that may be used by queries in the future). Also, before you start inserting data in your tables, you need to plan how to archive this data. Partitions maybe? Separate archive tables? As long as you can keep the tables reasonably small, you won’t have problems with adding a new index.

Of course, your mileage may vary - we used time as a main differentiating factor because an ALTER on a 10GB table may take minutes or hours. You also need to remember that pt-online-schema-change has its limitations - if a table has triggers, you may need to use rolling schema upgrade on it. Same with foreign keys. This is another question to answer while designing the schema - do you need triggers? Can it be done from within app? Are foreign keys required or can you have some consistency checks in the application? It is very likely that developers will push on using all those database features, and that’s perfectly understandable - they are there to be used. But you, as a DBA, will have to assess all of the pros and cons and help them decide whether the pros of using all those database features are larger than the cons of maintaining a database that is full of triggers and foreign keys. Schema changes will happen and eventually you’ll have to perform them. Not having an option to run pt-online-schema-change may significantly limit your possibilities.

Related Blogs


Blog category:

Deploying Galera Cluster for MySQL using Vagrant

$
0
0

Setting up environments, starting processes, and monitoring these processes on multiple machines can be time consuming and error prone - stale settings from previous test runs, wrong configurations, wrong commands, package conflicts, etc.. quite a few things can go wrong. If you are using Galera Cluster, you would probably want application developers to have a proper development environment on their local computers. Proper here means testing your code on a local Galera Cluster, not on a single instance MySQL. Galera Cluster differs from a single instance MySQL, so this allows you to catch these differences early in the project. But how can you quickly roll out a mini test clusters to your application developers, without having them waste time setting these up? This is where Vagrant comes in.

Vagrant is a system that allows you to easily create and move development environments from one machine to another. Simply define what type of VM you want in a file called Vagrantfile and then fire them up with a single command. It integrates well with virtual machine providers like VirtualBox, VMware and AWS. In this blog, we’ll show you how to expedite the deployment of your development environment using some Vagrant boxes we’ve put together.

Our Vagrantfile deploys 4 instances on VirtualBox platform, three for Galera nodes plus one for ClusterControl. It requires the following Vagrant boxes available on our site:

  • s9s-cc (505 MB) - Ubuntu 14.04.x, ClusterControl 1.2.10
  • s9s-galera (407 MB) - Ubuntu 14.04.x, Percona XtraDB Cluster 5.6

Here are the main steps:

  1. Install Vagrant and Virtualbox
  2. Download the related Vagrant boxes and Vagrantfile
  3. Launch the instances
  4. Bootstrap the Galera cluster
  5. Add the cluster to ClusterControl.

The following architecture diagram shows what you will get once everything is deployed:

Ensure that you have Vagrant and VirtualBox installed. We are not going to cover the installation of these in this blog post.

Deploying the Cluster

1.  Download and install the Vagrant boxes:

$ vagrant box add s9s-cc http://severalnines.com/downloads/cmon/s9s-cc.box
$ vagrant box add s9s-galera http://severalnines.com/downloads/cmon/s9s-galera.box

Make sure you keep the box names s9s-cc and s9s-galera, otherwise you’ll need to change the corresponding values in the Vagrantfile.

2. Create a directory and download the Vagrantfile:

$ mkdir s9s-cc
$ cd s9s-cc
$ wget http://severalnines.com/downloads/cmon/Vagrantfile

3. Launch 4 instances, each requires 768 MB of memory:

$ vagrant up

4. Verify if all instances are up with:

$ vagrant status

4. SSH to vm2 (n2) and run the start-node.sh script located under s9s directory. This will copy the relevant my.cnf file and bootstrap the Galera cluster:

$ vagrant ssh vm2
vagrant@n2:~$ cd s9s
vagrant@n2:~$ ./start-node.sh

5. Execute the same on vm3 (n3) and vm4 (n4). This will copy the relevant my.cnf file and start the node to join n2:

$ vagrant ssh vm3
vagrant@n3:~$ cd s9s
vagrant@n3:~$ ./start-node.sh
$ vagrant ssh vm4
vagrant@n4:~$ cd s9s
vagrant@n4:~$ ./start-node.sh

At this point, our Galera cluster should be up and running. You should be able to access each MySQL server on its respective IP address and port. The default MySQL root password is root123 while the ‘cmon’ password is cmon.

Adding Galera Cluster into ClusterControl

Once Galera Cluster is running, add it to ClusterControl. Open a web browser and point it to http://localhost:8080/clustercontrol. Create a default admin user with a valid email address and password, and click ‘Register & Create User’. 

Once logged in, click on ‘Add Existing Server/Cluster’, and enter the following details:

Click ‘Add Cluster’ and monitor the output of cluster jobs. Once done, you should able to see the Galera Cluster listed:

That’s it! Quick, simple and works every time :-)

Blog category:


Become a MySQL DBA blog series - Common operations - Replication Topology Changes

$
0
0

MySQL replication has been available for years, and even though a number of new clustering technologies showed up recently, replication is still very common among MySQL users. It is understandable as replication is a reliable way of moving your data between MySQL instances. Even if you use Galera or NDB cluster, you still may have to rely on MySQL replication to distribute your databases across WAN.

In this blog post we’d like to discuss one of the most common operations DBA has to handle - replication topology changes and planned failover. 

This is the fifth installment in the ‘Become a MySQL DBA’ blog series, and discusses one of the most common operations a DBA has to handle - replication topology changes and planned failover. Our previous posts in the DBA series include Schema Changes, High Availability, Backup & Restore, Monitoring & Trending.

Replication topology changes

In a previous blog post, we discussed the schema upgrade process and one of the ways to execute it is to perform a rolling upgrade - an operation that requires changes in replication topology. We’ll now see how this process is actually performed, and what you should keep an eye on. The whole thing is really not complex - what you need to do is to pick a slave that will become a master later on, reslave the remaining slaves off it, and then failover. Let’s get into the details.

Topology changes using GTID

First things first, the whole process depends on whether you use Global Transaction ID or regular replication. If you use GTID, you are in much better position as GTID allows you to move a host into any position in the replication chain. There’s no need for preparations, you just move the slaves around using:

STOP SLAVE;
CHANGE MASTER TO master_host='host', master_user='user', master_password='password', master_auto_position=1;
START SLAVE;

We’ll describe the failover process later in more detail, but what needs to be said now is that, once you make a failover, you’ll end up with a master host that is out of sync. There are ways to avoid that (and we’ll cover them), but if you use GTID, the problem can be easily fixed - all you need to do is to slave the old master off any other host using the command above. The old master will connect, retrieve any missing transactions, and get back in sync.

Topology changes using standard replication

Without GTID, things are definitely more complex as you can’t rely on a slave being aware of the transactions that are missing. The most important rule to keep in mind is that you have to ensure your slaves are in a known position to each other before any topology change is performed. Consider the following example.

Let’s assume the following, rather typical, replication topology: one master and three slaves.

Let’s also assume that you are executing a rolling schema change and you’d like to promote  “DB2” to become the new master. At the end you’d like the replication topology to look like this:

What needs to be accomplished is to slave DB3 and DB4 off DB2 and then finally, after the failover, to slave DB1 off DB2. Let’s start with DB3 and DB4.

If you plan to slave DB3 and DB4 off DB2, you need to enable binlogs on that host and enable log-slave-updates option. Otherwise it won’t record events from DB1 in it’s binary logs.

What’s required in the reslaving process is to have all of the involved nodes stopped at the same transaction in relation to the master. There are couple of ways to achieve that. One of them is to use START SLAVE UNTIL ... to stop them in a known position. Here is how you do that. We need to check the SHOW MASTER STATUS on the master host (DB1 in our case):

mysql> show master status\G
*************************** 1. row ***************************
             File: mysql-bin.000119
         Position: 448148420
     Binlog_Do_DB:
 Binlog_Ignore_DB:

Then, on all involved hosts (DB2, DB3 and DB4), we need to stop replication and then start it again, this time using START SLAVE UNTIL and setting it to stop at the first event, two binary logs later.

You can find a position of the first event by running mysqlbinlog on one of the binary logs:

mysqlbinlog /mysqldata/mysql-bin.000112 | head -n 10
/*!50530 SET @@SESSION.PSEUDO_SLAVE_MODE=1*/;
/*!40019 SET @@session.max_insert_delayed_threads=0*/;
/*!50003 SET @OLD_COMPLETION_TYPE=@@COMPLETION_TYPE,COMPLETION_TYPE=0*/;
DELIMITER /*!*/;
# at 4
#150705 23:45:22 server id 153011  end_log_pos 120 CRC32 0xcc4ee3be     Start: binlog v 4, server v 5.6.24-72.2-log created 150705 23:45:22
BINLOG '
ksGZVQ+zVQIAdAAAAHgAAAAAAAQANS42LjI0LTcyLjItbG9nAAAAAAAAAAAAAAAAAAAAAAAAAAAA
AAAAAAAAAAAAAAAAAAAAAAAAEzgNAAgAEgAEBAQEEgAAXAAEGggAAAAICAgCAAAACgoKGRkAAb7j
Tsw=

In our case, the first event is at the position of 4 therefore we want to start the slaves in the following manner:

START SLAVE UNTIL master_log_file='mysql-bin.000121', master_log_pos=4;

All slaves should catch up and proceed with the replication. Next step is to stop them - you can do it by issuing FLUSH LOGS on the master two times. This will rotate binlogs and eventually open a mysql-bin.000121 file. All slaves should stop at the same position (4) of this file. In this way we managed to bring all of them to the same position.

Once that’s done, the rest is simple - you need to ensure that the binlog position (checked using SHOW MASTER STATUS) doesn’t change on any of the nodes. It shouldn’t as the replication is stopped. If it does change, something is issuing writes to the slaves which is very bad position to be in - you need to investigate before you can perform any further changes. If everything is ok, then all you need is to grab the current stable binary log coordinates of DB2 (future master) and then execute CHANGE MASTER TO … on DB3 and DB4 using those positions and slaving those hosts off DB2. Once it’s done, you can commence replication on the DB2. At this point you should have following replication topology:

As we are talking about planned failover, we want to ensure that after it’s done, we can slave DB1 off DB2. For that, we need to confirm that the writes from DB2 (which will happen after the failover), will end up in DB1 as well. We can do it by setting up master - master replication between those two nodes. It’s a very simple process, as long as DB2 is not yet written to. If it is, then you might be in trouble - you’ll need to identify the source of these writes and remove it. One of the ways to check it is to convert binary logs to the plain text format using the mysqlbinlog utility and then look for the server id’s. You should not see any id’s other than that of the master.

If there are no writes hitting DB2, then you can go ahead and execute CHANGE MASTER TO … on DB1 pointing it to the DB2 and using any recent coordinates - no need to stop the replication as it is expected that no writes will be executed on DB1 while we fail over. Once you slave DB1 off DB2, you can monitor replication for any unexpected writes coming from DB2 by watching Exec_Master_Log_Pos in the SHOW SLAVE STATUS. On DB1 it should be constant as there should be nothing to execute. At this time, we have the following replication topology ready for the failover:

Failover process

Failover process is tricky to describe as it is strongly tied to the application - your requirements and procedures may vary from what we’ll describe here. Still, we think it’s a good idea to go over this process and point to some important bits that should be common for many applications.

Assuming that you have your environment in the state we described above (all slaves slaved off the master candidate and master in master-master replication with the master candidate), there’s not much else to do on the database side - you are well prepared. The rest of the process is all about ensuring that there are no violations of consistency during the failover. For that, the best way is to stop the application. Unfortunately, it is also the most expensive way.

When your application is down, you want to ensure that the database does not handle any writes and there are no new connections getting through. Writes can be verified by checking the SHOW MASTER STATUS output. Connections - by checking either processlist or Com-* counters. In general, as long as there are no writes, you should be just fine - it is not that big of a problem if there is a forgotten connection that is executing SELECTs.  It would be a problem if it executes DML from time to time.

Once you verified that no DML hits the database, you need to repoint your application to the new master. In our example, that would be DB2. Again, all depends on how exactly you have your environment set up. If you have a proxy layer, you may need to implement some changes there. You should strive to automate this process, though, using scripts that’d detect whether a node is a master or a slave. This speeds things up and results in less mistakes. A common practice is to use read_only setting to differentiate master from slaves. Proxies can then detect if the node is a master or not, and route traffic accordingly. If you use this method, you can, as soon as you confirm no writes are coming, just set the read_only=1 on DB1 and then set read_only=0 on DB2 - it should be enough to repoint the proxy to a correct host.

No matter how you repoint the app (by changing read_only setting, proxy or app configuration or a DNS entry), once you’re done with it, you should test if the application works correctly after the change. In general, it’s great to have a “test-only” mode of an app - an option to keep it offline from public access but allow you to do some testing and QA before going live after such significant change. During those tests you may want to keep an eye on the old master (DB1 in our case). It should not take any writes, yet it is not uncommon to see that some forgotten piece of code is hardcoded to connect directly to a given database and that will cause problems. If you have DB1 and DB2 in master - master replication, you should be good in terms of the data consistency. If not, this is something you need to fix before going live again.

Finally, once you verified you are all good, you can go back live and monitor the system for a while. Again, you want to keep an eye on the old master to ensure there are no writes hitting it.

As you can imagine, replication topology changes and failover processes are common operations, albeit complex. In future posts, we will discuss rolling MySQL upgrades and migrations between different environments. As we mentioned earlier, even if you use Galera or NDB Cluster you may need to use replication to connect different datacenters or providers over a WAN,  and eventually perform the standard planned failover process that we described above. 

Blog category:

Webinar Replay & Slides: Become a MySQL DBA - Deciding on a relevant backup solution

$
0
0

Thanks to everyone who joined us last week for this live session on backup strategies for MySQL and Galera clusters led by Krzysztof Książek, Senior Support Engineer at Severalnines. The replay and slides to the webinar are now available to watch and read online via the links below.

Watch the replay

 
Read the slides

Backup and restore is one of the most important aspects of database administration. If a database crashed and there was no way to recover it, any resulting data loss might lead to devastating results to a business. As the DBA operating a MySQL or Galera cluster in production, you need to ensure your backups are scheduled, executed and regularly tested.

In this webinar, we discussed the multiple ways to take backups, which method best fits specific needs and how to implement point in time recovery.

AGENDA

  • Logical and Physical Backup methods
    • Tools
    • mysqldump
    • mydumper
    • xtrabackup
    • snapshots
  • How backups are done in ClusterControl
  • Best practices
  • Example Setups
    • On premises / private datacenter
    • Amazon Web Services

SPEAKER

Krzysztof Książek, Senior Support Engineer at Severalnines, is a MySQL DBA with experience managing complex database environments for companies like Zendesk, Chegg, Pinterest and Flipboard. This webinar builds upon recent blog posts and related webinar series by Krzysztof on how to become a MySQL DBA.

database-backup-icons.jpg

Blog category:

Become a MySQL DBA - Webinar series: Which High Availability Solution?

$
0
0

There are many many approaches to MySQL high availability - from traditional, loosely-coupled database setups based on asynchronous replication to more modern, tightly-coupled architectures based on synchronous replication. These offer varying degrees of protection, and DBAs almost always have to choose a trade-off between high-availability and cost.

In this webinar, we will look at some of the most widely used HA alternatives in the MySQL world and discuss their pros and cons.

DATE & TIME

Europe/MEA/APAC
Tuesday, July 28th at 09:00 BST / 10:00 CEST (Germany, France, Sweden)
Register Now

North America/LatAm
Tuesday, July 28th at 09:00 Pacific Time (US) / 12:00 Eastern Time (US)
Register Now

AGENDA

  • HA - what is it?
  • Caching layer
  • HA solutions
    • MySQL Replication
    • MySQL Cluster
    • Galera Cluster
    • Hybrid Replication
  • - Proxy layer
    • HAProxy
    • MaxScale
    • Elastic Load Balancer (AWS)
  • - Common issues
    • Split brain scenarios 
    • GTID-based failover and Errant Transactions

SPEAKER

Krzysztof Książek, Senior Support Engineer at Severalnines, is a MySQL DBA with experience managing complex database environments for companies like Zendesk, Chegg, Pinterest and Flipboard. This webinar builds upon recent blog posts and related webinar series by Krzysztof on how to become a MySQL DBA.

We look forward to “seeing” you there and to insightful discussions!

Blog category:

s9s Tools and Resources: The 'Become a MySQL DBA' Series, ClusterControl 1.2.10, Advisors and More!

$
0
0

Check Out Our Latest Technical Resources for MySQL, MariaDB, Postgres and MongoDB

This blog is packed with all the latest resources and tools we’ve recently published! Please do check it out and let us know if you have any comments or feedback.

Live Technical Webinar

In this webinar, we will look at some of the most widely used HA alternatives in the MySQL world and discuss their pros and cons. Krzysztof is a MySQL DBA with experience managing complex database environments for companies like Zendesk, Chegg, Pinterest and Flipboard. This webinar builds upon recent blog posts by Krzysztof on OS and database monitoring.

Register for the webinar

Product Announcements & Resources

ClusterControl 1.2.10 Release

We were pleased to announce a milestone release of ClusterControl in May, which includes several brand new features, making it a fully programmable DevOps platform to manage leading open source databases.

ClusterControl Developer Studio Release

With ClusterControl 1.2.10, we introduced our new, powerful ClusterControl DSL (Domain Specific Language), which allows you to extend the functionality of your ClusterControl platform by creating Advisors, Auto Tuners, or “mini Programs”. Check it out and start creating your own advisors! We’d love to hear your feedback!

Technical Webinar - Replay

We recently started a ‘Become a MySQL DBA’ blog and webinar series, which we’re extending throughout the summer. Here are the first details of that

Become a MySQL DBA - Deciding on a relevant backup solution

In this webinar, we discussed the multiple ways to take backups, which method best fits specific needs and how to implement point in time recovery.

Watch the replay and view the slides here


Technical Blogs

Here is a listing of our most recent technical blogs. Do check them out and let us know if you have any questions.

Become a MySQL DBA Blog Series

Further Technical Blogs:

We are hiring!

We’re looking for an enthusiastic frontend developer! If you know of anyone, who might be interested, please do let us know.

We trust these resources are useful. If you have any questions on them or on related topics, please do contact us!

Your Severalnines Team

Blog category:

How to Avoid SST when adding a new node to Galera Cluster for MySQL or MariaDB

$
0
0

State Snapshot Transfer (SST) is a way for Galera to transfer a full data copy from an existing node (donor) to a new node (joiner). If you come from a MySQL replication background, it is similar to taking a backup of a master and restoring on a slave. In Galera Cluster, the process is automated and is triggered depending on the joiner state.

SST can be painful in some occasions, as it can block the donor node (with SST methods like mysqldump or rsync) and burden it when backing up the data and feeding it to the joiner. For a dataset of a few hundred gigabytes or more, the syncing process can take hours to complete - even if you have a fast network. It might be advisable to avoid e.g. when running in WAN environments with slower connects and limited bandwidth, or if you just want a very fast way of introducing a new node in your cluster.

In this blog post, we’ll show you how to avoid SST. 

SST Methods

Through the variable wsrep_sst_method, it is possible to set the following methods:

  • mysqldump
  • rsync
  • xtrabackup/xtrabackup-v2

xtrabackup is non-blocking for the donor. Use xtrabackup-v2 (and not xtrabackup) if you are running on MySQL version 5.5.54 and later. 

Incremental State Transfer (IST)

To avoid SST, we’ll make use of IST and gcache. IST is a method to prepare a joiner by sending only the missing writesets available in the donor’s gcache. gcache is a file where a Galera node keeps a copy of writesets. IST is faster than SST, it is non-blocking and has no significant performance impact on the donor. It should be the preferred option whenever possible.

IST can only be achieved if all changes missed by the joiner are still in the gcache file of the donor. You will see the following in the donor’s MySQL error log:

WSREP: async IST sender starting to serve tcp://10.0.0.124:4568 sending 689768-761291

And on the joiner side:

150707 17:15:53 [Note] WSREP: Signalling provider to continue.
150707 17:15:53 [Note] WSREP: SST received: d38587ce-246c-11e5-bcce-6bbd0831cc0f:689767
150707 17:15:53 [Note] WSREP: Receiving IST: 71524 writesets, seqnos 689767-761291


Determining a good gcache size

Galera uses a pre-allocated gcache file of a specific size to store writesets in circular buffer style. By default, its size is 128MB. We have covered this in details here. It is important to determine the right size of the gcache size, as it can influence the data synchronization performance among Galera nodes.

The below gives an idea of the amount of data replicated by Galera. Run the following statement on one of the Galera node during peak hours (this works on MariaDB 10 and PXC 5.6, galera 3.x):

mysql> set @start := (select sum(VARIABLE_VALUE/1024/1024) from information_schema.global_status where VARIABLE_NAME like 'WSREP%bytes'); do sleep(60); set @end := (select sum(VARIABLE_VALUE/1024/1024) from information_schema.global_status where VARIABLE_NAME like 'WSREP%bytes'); set @gcache := (select SUBSTRING_INDEX(SUBSTRING_INDEX(SUBSTRING_INDEX(SUBSTRING_INDEX(variable_value,';',29),';',-1),'=',-1),'M',1) from information_schema.global_variables where variable_name  like 'wsrep_provider_options'); select round((@end - @start),2) as `MB/min`, round((@end - @start),2) * 60 as `MB/hour`, @gcache as `gcache Size(MB)`, round(@gcache/round((@end - @start),2),2) as `Time to full(minutes)`;

+--------+---------+-----------------+-----------------------+
| MB/min | MB/hour | gcache Size(MB) | Time to full(minutes) |
+--------+---------+-----------------+-----------------------+
|   7.95 |  477.00 |  128            |                 16.10 |
+--------+---------+-----------------+-----------------------+

We can tell that the Galera node can have approximately 16 minutes of downtime, without requiring SST to join (unless Galera cannot determine the joiner state). If this is too short time and you have enough disk space on your nodes, you can change the wsrep_provider_options=”gcache.size=<value>” to an appropriate value. In this example, setting gcache.size=1G allows us to have 2 hours of node downtime with high probability of IST when the node rejoins.

Avoiding SST on New Node

Sometimes, SST is unavoidable. This can happen when Galera fails to determine the joiner state when a node is joining. The state is stored inside grastate.dat. Should the following scenarios happen, SST will be triggered:

  • grastate.dat does not exist under MySQL data directory - it could be a new node with a clean data directory, or e.g., the DBA manually deleted the file and intentionally forces Galera to perform SST 
  • This grastate.dat file has no seqno or group ID. This node crashed during DDL.
  • The seqno inside grastate.dat shows -1 while the MySQL server is still down, which means unclean shutdown or MySQL crashed/aborted due to database inconsistency. (Thanks to Jay Janssen from Percona for pointing this out)
  • grastate.dat is unreadable, due to lack of permissions or corrupted file system.

To avoid SST, we would get a full backup from one of the available nodes, restore the backup on the new node and create a Galera state file so Galera can determine the node’s state and skip SST. 

In the following example, we have two Galera nodes with a garbd. We are going to convert the garbd node to a MySQL Galera node (Db3). We have a full daily backup created using xtrabackup. We’ll create an incremental backup to get as close to the latest data before IST.

1. Install MySQL server for Galera on Db3. We will not cover the installation steps here. Please use the same Galera vendor as for the existing Galera nodes (Codership, Percona or MariaDB). If you are running ClusterControl, you can just use ‘Add Node’ function and disable the cluster/node auto recovery beforehand (as we don’t want ClusterControl to automatically join the new node, that will trigger SST):

2. The full backup is stored on the ClusterControl node (refer to the diagram above). Firstly, copy and extract the full backup to Db3:

[root@db3]$ mkdir -p /restore/full
[root@db3]$ cd /restore/full
[root@db3]$ scp root@clustercontrol:/root/backups/mysql_backup/BACKUP-1/backup-full-2015-07-08_113938.xbstream.gz .
[root@db3]$ gunzip backup-full-2015-07-08_113938.xbstream.gz
[root@db3]$ xbstream -x < backup-full-2015-07-08_113938.xbstream

3. Increase the gcache size on all nodes to increase the chance of IST. Append the gcache.size parameter in wsrep_provider_options line in the MySQL configuration file:

wsrep_provider_options="gcache.size=1G"

Perform a rolling restart, one Galera node a time (ClusterControl user can use Manage > Upgrades > Rolling Restart):

$ service mysql restart

4. Before creating an incremental backup on Db1 to get the latest data since the last full backup, we need to copy back the xtrabackup_checkpoints file that we got from the extracted full backup on Db3. The incremental backup, when applied, will bring us closer to the current database state. Since we got 2 hours of buffer after increasing the gcache size, we should have enough time to restore the backup and create the necessary files to skip SST.  

Create a base directory, which in our case will be /root/temp. Copy xtrabackup_checkpoints from Db3 into it:

[root@db1]$ mkdir -p /root/temp
[root@db1]$ scp root@db3:/restore/backup/xtrabackup_checkpoints /root/temp/

5. Create a target directory for incremental backup in Db3:

[root@db3]$ mkdir -p /restore/incremental

6. Now it is safe to create an incremental backup on Db1 based on information inside /root/temp/xtrabackup_checkpoints and stream it over to Db3 using SSH:

[root@db1]$ innobackupex --user=root --password=password --incremental --galera-info --incremental-basedir=/root/temp --stream=xbstream ./ 2>/dev/null | ssh root@db3 "xbstream -x -C /restore/incremental"

If you don’t have a full backup, you can generate one by running the following command on Db1 and stream it directly to Db3:

[root@db1]$ innobackupex --user=root --password=password --galera-info --stream=tar ./ | pigz | ssh root@db3 "tar xizvf - -C /restore/full"

7. Prepare the backup files:

[root@db3]$ innobackupex --apply-log --redo-only /restore/full
[root@db3]$ innobackupex --apply-log /restore/full --incremental-dir=/restore/incremental

Ensure you got the following line at the end of the output stream as an indicator that the above succeeded:

150710 14:08:20  innobackupex: completed OK!

8. Build a Galera state file under the /restore/full directory based on the latest information from the incremental backup. You can get the information inside /restore/incremental/xtrabackup_galera_info:

[root@db3]$ cat /restore/full/xtrabackup_galera_info
d38587ce-246c-11e5-bcce-6bbd0831cc0f:1352215

Create a new file called grastate.dat under the full backup directory:

[root@db3]$ vim /restore/full/grastate.dat

And add the following lines (based on the xtrabackup_galera_info):

# GALERA saved state
version: 2.1
uuid:    d38587ce-246c-11e5-bcce-6bbd0831cc0f
seqno:   1352215
cert_index:

9. The backup is prepared and ready to be copied over to the MySQL data directory. Clear the existing path, copy the prepared data and assign correct ownership:

[root@db3]$ rm -Rf /var/lib/mysql/*
[root@db3]$ innobackupex --copy-back /restore/full
[root@db3]$ chown -Rf mysql.mysql /var/lib/mysql

10. If you installed garbd through ClusterControl, remove it by going to Manage > Load Balancer > Remove Garbd > Remove and skip the following command. Otherwise, stop garbd service on this node:

[root@db3]$ killall -9 garbd

11. The new node is now ready to join the rest of the cluster. Fire it up:

[root@db3]$ service mysql start

Voila, the new node should bypass SST and sync via IST. Monitor the output of MySQL error log and ensure you see something like below:

150710 14:49:58 [Note] WSREP: Signalling provider to continue.
150710 14:49:58 [Note] WSREP: SST received: d38587ce-246c-11e5-bcce-6bbd0831cc0f:1352215
150710 14:49:58 [Note] WSREP: Receiving IST: 4921 writesets, seqnos 1352215-1357136


Blog category:

Viewing all 31 articles
Browse latest View live