Quantcast
Channel: Severalnines - MySQL
Viewing all 31 articles
Browse latest View live

Become a MySQL DBA blog series - Database upgrades

$
0
0

Database vendors typically release patches with bug/security fixes on a monthly basis, why should we care? The news is full of reports of security breaches and hacked systems, so unless security is not a concern, you might want to have the most current security fixes on your systems. Major versions are rarer, and usually harder (and riskier) to upgrade to. But they might bring along some important features that make the upgrade worth the effort.

In this blog post, we will cover one of the most basic tasks of the DBA - minor and major database upgrades.  

This is the sixth installment in the ‘Become a MySQL DBA’ blog series. Our previous posts in the DBA series include Replication Topology Changes, Schema Changes, High Availability, Backup & Restore, Monitoring & Trending.

MySQL upgrades

Once every couple of years, a MySQL version becomes outdated and is not longer supported by Oracle. It happened to MySQL 5.1 on December 4, 2013, and earlier to MySQL 5.0 on January 9, 2012. It will also happen to MySQL 5.5 somewhere in 2018, 8 years after the GA was released. It means that for both MySQL 5.0 and MySQL 5.1, users cannot rely on fixes - not even for serious, security bugs. This is usually the point where you really need to plan an upgrade of MySQL to a newer version.

You won’t be dealing only with major version upgrades, though - it’s more likely that you’ll be upgrading to minor versions more often, like 5.6.x -> 5.6.y. Most likely, it is so that the newest version brings some fixes for bugs that affect your workload, but it can be any other reason. 

There is a significant difference in the way you perform a major and a minor version upgrade.

Preparations

Before you can even think about performing an upgrade, you need to decide what kind of testing you need to do. Ideally, you have a staging/development environment where you do tests for your regular releases. If that is the case, the best way of doing pre-upgrade tests will be to build a database layer of your staging environment using the new MySQL version. Once that is done, you can proceed with a regular set of tests. More is better - you want to focus not only on the “feature X works/does not work” aspect but also performance.

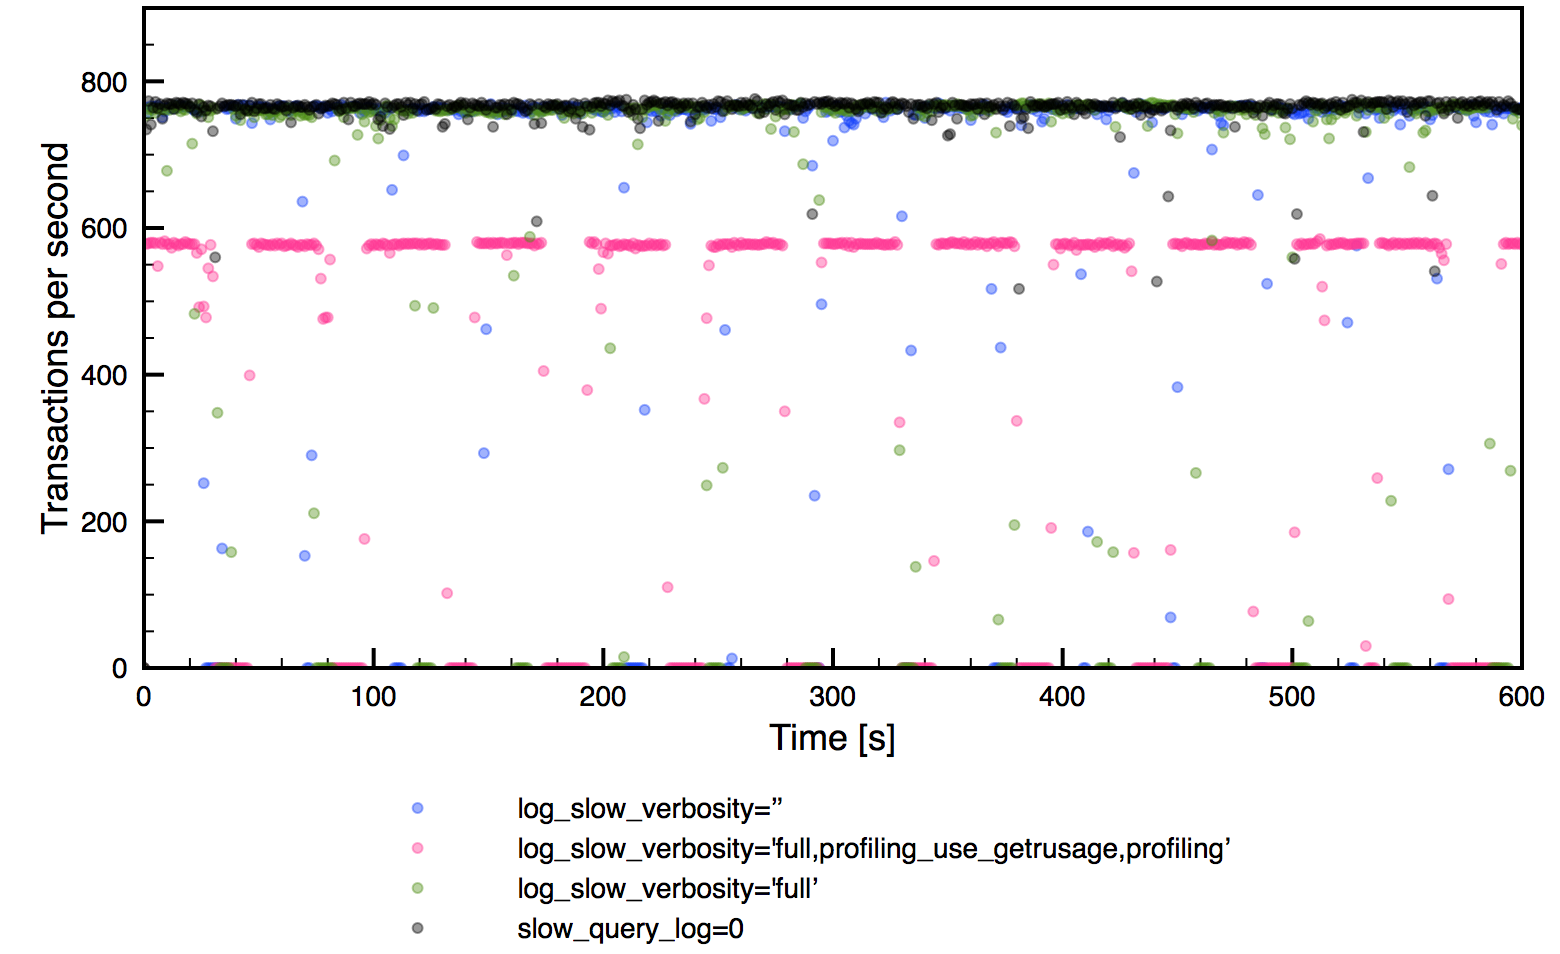
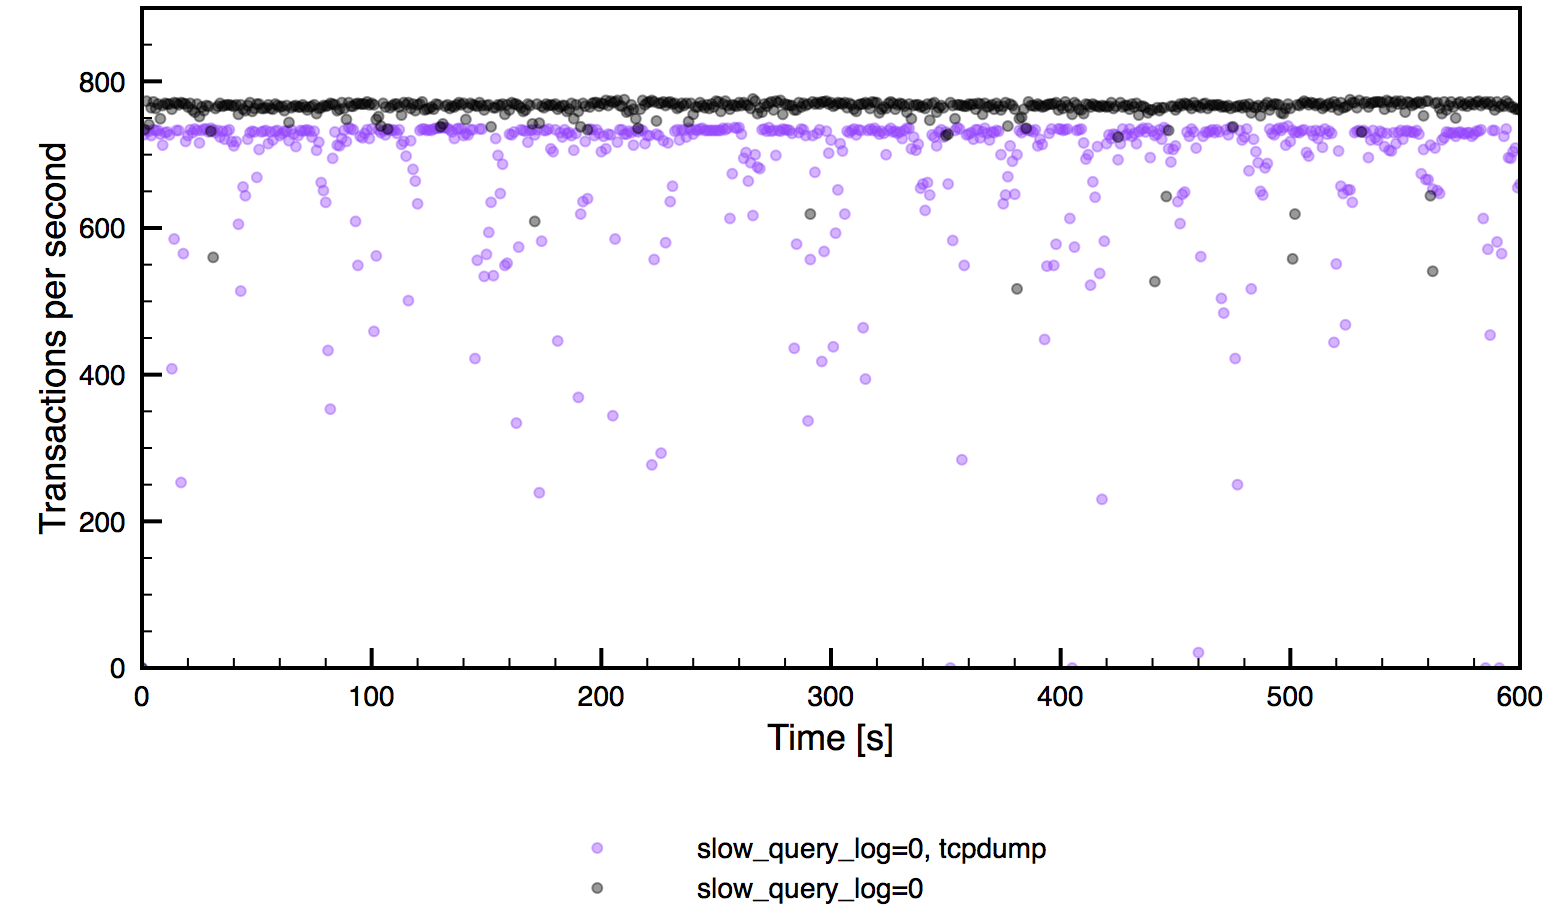
On the database side, you can also do some generic tests. For that you would need a list of queries in a slow log format. Then you can use pt-upgrade to run them on both the old and the new MySQL version, comparing the response time and result sets. In the past, we have noticed that pt-upgrade returns a lot of false positives - it may report a query as slow while in fact, the query is perfectly fine on both versions. For that, you may want to introduce some additional sanity checks - parse pt-upgrade output, grab the slow queries it reported, execute them once more on the servers and compare the results again. What you need to keep in mind that you should connect to both old and new database servers in the same way (socket connection will be faster than TCP).

Typical results from such generic tests are queries where the execution plan has changed - usually it’s enough to add some indexes or force the optimizer to pick a correct one. You can also see queries with discrepancies in the result set - it’s most likely a result of lack of explicit ORDER BY in the query - you can’t rely on rows being sorted the way they are if you didn’t sort them explicitly.

Minor version upgrades

A minor upgrade is relatively easy to perform - most of the time, all you need to do is to just install the new version using the package manager of your distribution. Once you do that, you need to ensure that MySQL has been started after the upgrade and then you should run the mysql_upgrade script. This script goes through the tables in your database and ensures all of them are compatible with the current version. It may also fix your system tables if required.

Obviously, installing the new version of a package requires the service to be stopped. Therefore you need to plan the upgrade process. It may slightly differ depending if you use Galera Cluster or MySQL replication.

MySQL replication

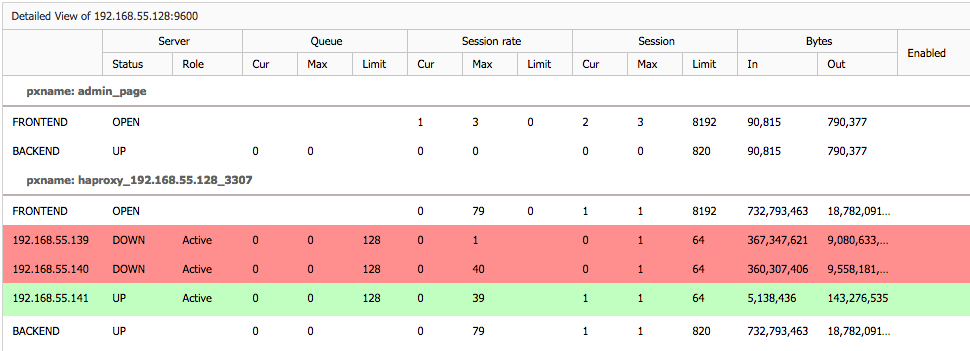
When we are dealing with MySQL replication, the upgrade process is fairly simple. You need to upgrade slave by slave, taking them out of rotation for the time required to perform the upgrade (it is a short time if everything goes right, not more than few minutes of downtime). For that you may need to do some temporary changes in your proxy configuration to ensure that the traffic won’t be routed to the slave that is under maintenance. It’s hard to give any details here because it depends on your setup. In some cases, it might not even be needed to make any changes as the proxy can adapt to topology changes on it’s own and detects which node is available and which is not. That’s how you should configure your proxy, by the way.

Once every slave has been updated, you need to execute a planned failover. We discussed the process in an earlier blog post. The process may also depend on your setup. It doesn’t have to be manual one if you have tools to automate it for you (MHA for example). Once a new master is elected and failover is completed, you should perform the upgrade on the old master which, at this point, should be slaving off the new master. This will conclude minor version upgrade for the MySQL replication setup.

Galera Cluster

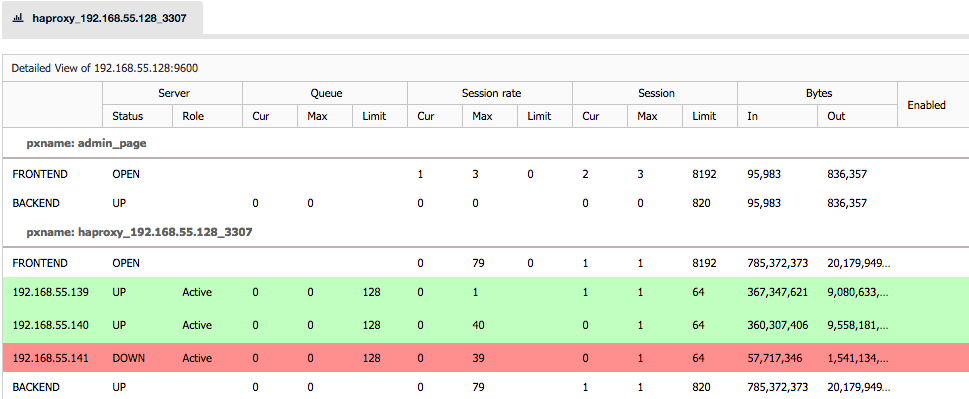
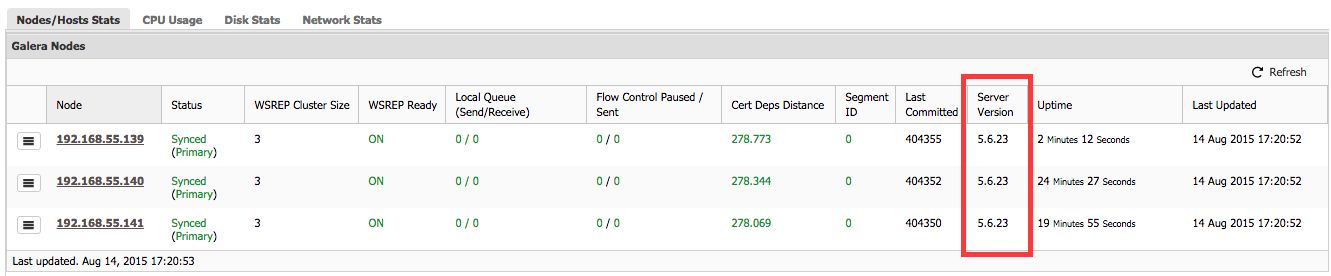
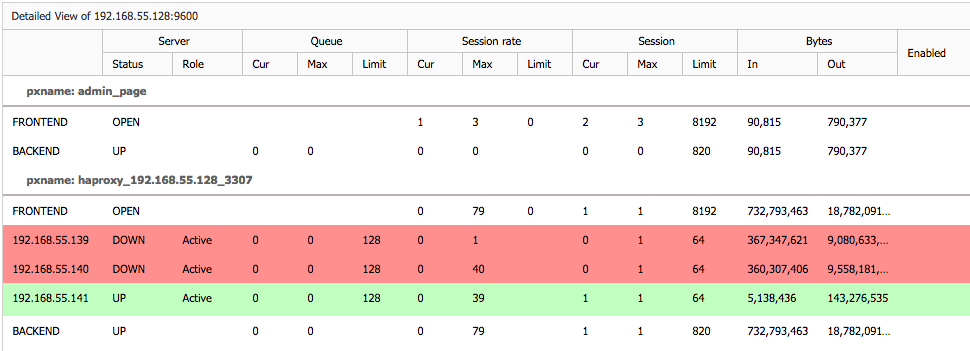
With Galera, it is somewhat easier to perform upgrades - you need to stop the nodes one by one, upgrade the stopped node and then restart before moving to the next. If your proxy needs some manual tweaks to ensure traffic won’t hit nodes which are undergoing maintenance, you will have to make those changes. If it can detect everything automatically, all you need to do is to stop MySQL, upgrade and restart. Once you gone over all nodes in the cluster, the upgrade is complete.

Major version upgrades

A major version upgrade in MySQL would be 5.x -> 5.y or even 4.x > 5.y. Such upgrade is more tricky and complex that the minor upgrades we just covered in earlier paragraphs.

The recommended way of performing the upgrade is to dump and reload the data - this requires some time (depends on the database size) but it’s usually not feasible to do it while the slave is out of rotation. Even when using mydumper/myloader, the process will take too long. In general, if the dataset is larger than a hundred of gigabytes, it will probably require additional preparations.

While it might be possible to do just a binary upgrade (install new packages), it is not recommended as there could be some incompatibilities in binary format between the old version and the new one, which, even after mysql_upgrade has been executed, may still cause some problems. We’ve seen cases where a binary upgrade resulted is some weird behavior in how the optimizer works, or caused instability. All those issues were solved by performing the dump/reload process. So, while you may be ok to run a binary upgrade, you may also run into serious problems - it’s your call and eventually it’s your decision. If you decide to perform a binary upgrade, you need to do detailed (and time-consuming) tests to ensure it does not break anything. Otherwise you are at risk. That’s why dump and reload is the officially recommended way to upgrade MySQL and that’s why we will focus on this approach to the upgrade.

MySQL replication

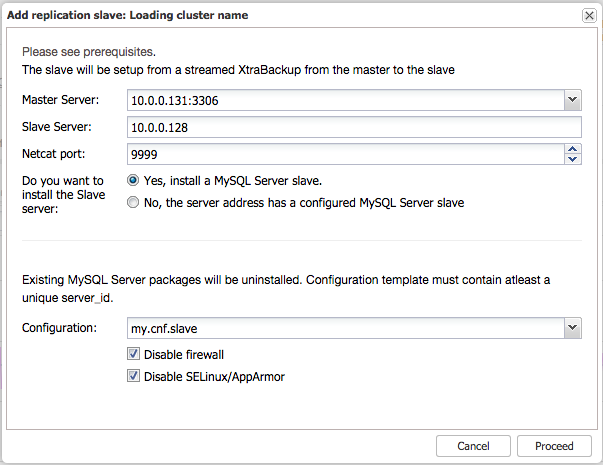
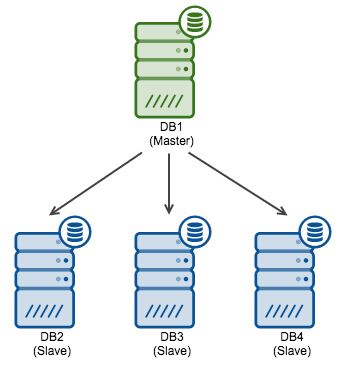
If our setup is based on MySQL replication, we will build a slave on the new MySQL version. Let’s say we are upgrading from MySQL 5.5 to MySQL 5.6. As we have to perform a long dump/reload process, we may want to build a separate MySQL host for that. A simplest way would be to use xtrabackup to grab the data from one of the slaves along with the replication coordinates. That data will allow you to slave the new node off the old master. Once the new node (still running MySQL 5.5 - xtrabackup just moves the data so we have to use the same, original, MySQL version) is up and running, it’s time to dump the data. You can use any of the logical backup tools that we discussed in our earlier post on Backup and Restore. It doesn’t matter as long as you can restore the data later.

After the dump had been completed, it’s time to stop the MySQL, wipe out the current data directory, install MySQL 5.6 on the node, initialize the data directory using mysql_install_db script and start the new MySQL version. Then it’s time to load the dumps - a process which also may take a lot of time. Once done, you should have a new and shiny MySQL 5.6 node. It’s time now to sync it back with the master - you can use coordinates collected by xtrabackup to slave the node off a member of the production cluster running MySQL 5.5. What’s important to remember here is that, as you want to eventually slave the node off the current production cluster, you need to ensure that binary logs won’t rotate out. For large datasets, the dump/reload process may take days so you want to adjust expire_logs_days accordingly on the master. You also want to confirm you have enough free disk space for all those binlogs.

Once we have a MySQL 5.6 slaving off MySQL 5.5 master, it’s time to go over the 5.5 slaves and upgrade them. The easiest way now would be to leverage xtrabackup to copy the data from the 5.6 node. So, we take a 5.5 slave out of rotation, stop the MySQL server, wipe out data directory, upgrade MySQL to 5.6, restore data from the other 5.6 slave using xtrabackup. Once that’s done, you can setup the replication again and you should be all set.

This process is much faster than doing dump/reload for each of the slaves - it’s perfectly fine to do it once per replication cluster and then use physical backups to rebuild other slaves. If you use AWS, you can rely on EBS snapshots instead of xtrabackup. Similar to the logical backup, it doesn’t really matter how you rebuild the slaves as long as it will work.

Finally, once all of the slaves were upgraded, you need to failover from the 5.5 master to one of the 5.6 slaves. At this point it may happen that you won’t be able to keep the 5.5 in the replication (even if you setup master - master replication between them). In general, replicating from a new version of MySQL to an older one is not supported - replication might break. One way or another, you’ll want to upgrade and rebuild the old master using the same process as with slaves.

Galera Cluster

Compared to MySQL Replication, Galera is, at the same time, both trickier and easier to upgrade. A cluster created with Galera should be treated as a single MySQL server. This is crucial to remember when discussing Galera upgrades - it’s not a master with some slaves or many masters connected to each other - it’s like a single server. To perform an upgrade of a single MySQL server you need to either do the offline upgrade (take it out of rotation, dump the data, upgrade MySQL to 5.6, load the data, bring it back into rotation) or create a slave, upgrade it and finally failover to it (the process we described in the previous section, while discussing MySQL replication upgrade).

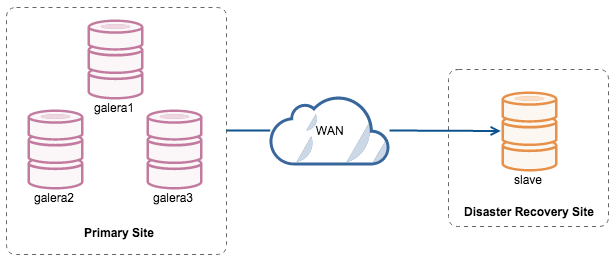
Same thing applies for Galera cluster - you either take everything down for the upgrade (all nodes) or you have to build a slave - another Galera cluster connected via MySQL replication.

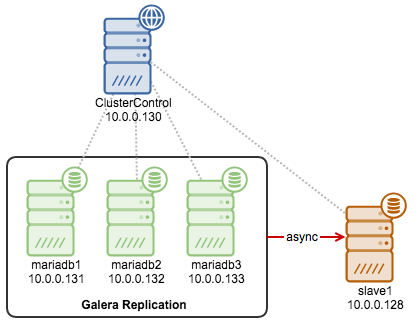
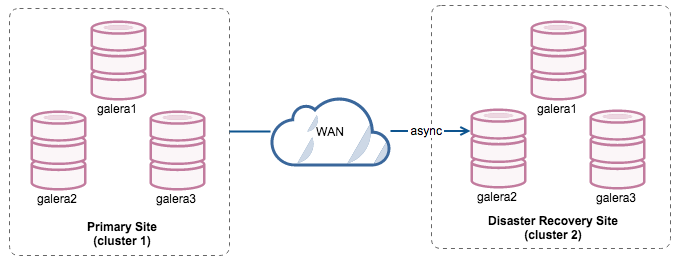
An online upgrade process may look as follows. For starters, you need to create the slave on MySQL 5.6 - process is exactly the same as above: create a node with MySQL 5.5 (it can be a Galera but it’s not required), use xtrabackup to copy the data and replication coordinates, dump the data using a logical backup tool, wipe out the data directory, upgrade MySQL to 5.6 Galera, bootstrap the cluster, load the data, slave the node off the 5.5 Galera cluster.

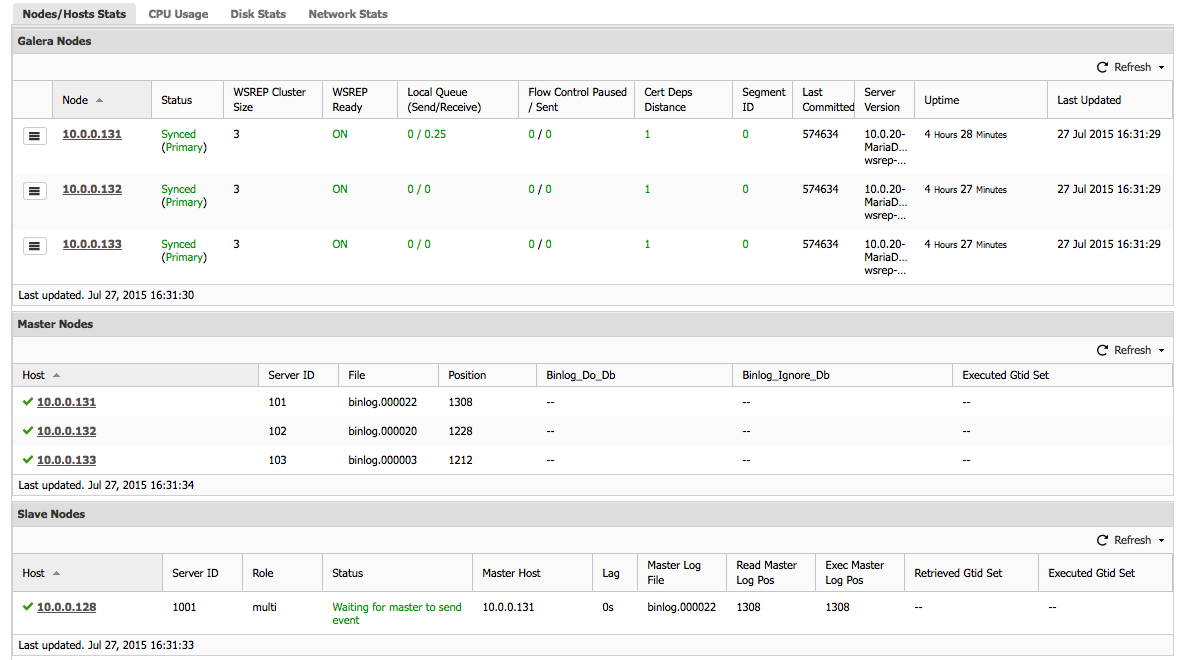
At this point you should have two Galera clusters - 5.5 and a single node of Galera 5.6, both connected via replication. Next step will be to build the 5.6 cluster to a production size. It’s hard to tell how to do it - if you are in the cloud, you can just spin up new instances. If you are using colocated servers in a datacenter, you may need to move some of the hardware from the old to the new cluster. You need to keep in mind the total capacity of the system to make sure it can cope with some nodes taken out of rotation. While hardware management may be tricky, what is nice is that you don’t have to do much regarding building the 5.6 cluster - Galera will use SST to populate new nodes automatically.

In general, the goal of this phase is to build a 5.6 cluster that’s large enough to handle the production workload. Once it’s done, you need to failover to 5.6 Galera cluster - this will conclude the upgrade. Of course, you may still need to add some more nodes to it but it’s now a regular process of provisioning Galera nodes, only now you use 5.6 instead of 5.5.


Blog category:


Webinar Replay & Slides: Become a MySQL DBA - Designing High Availability for MySQL

$
0
0

Thanks to everyone who joined us yesterday for this live session on designing HA for MySQL led by Krzysztof Książek, Senior Support Engineer at Severalnines. The replay and slides to the webinar are now available to watch and read online via the links below.

Watch the replay:


Read the slides:


AGENDA

  • HA - what is it?
  • Caching layer
  • HA solutions
    • MySQL Replication
    • MySQL Cluster
    • Galera Cluster
    • Hybrid Replication
  • Proxy layer
    • HAProxy
    • MaxScale
    • Elastic Load Balancer (AWS)
  • Common issues
    • Split brain scenarios
    • GTID-based failover and Errant Transactions


SPEAKER

Krzysztof Książek, Senior Support Engineer at Severalnines, is a MySQL DBA with experience managing complex database environments for companies like Zendesk, Chegg, Pinterest and Flipboard. This webinar builds upon recent blog posts and related webinar series by Krzysztof on how to become a MySQL DBA.

For further blogs in this series visit: http://www.severalnines.com/blog-categories/db-ops

Blog category:

Deploy Asynchronous Replication Slave to MariaDB Galera Cluster 10.x using ClusterControl

$
0
0

Combining Galera and asynchronous replication in the same MariaDB setup, aka Hybrid Replication, can be useful - e.g. as a live backup node in a remote datacenter or reporting/analytics server. We already blogged about this setup for Codership/Galera or Percona XtraDB Cluster users, but master failover did not work for MariaDB because of its different GTID approach. In this post, we will show you how to deploy an asynchronous replication slave to MariaDB Galera Cluster 10.x (with master failover!), using GTID with ClusterControl v1.2.10. 

Preparing the Master

First and foremost, you must ensure that the master and slave nodes are running on MariaDB Galera 10.0.2 or later. MariaDB replication slave requires at least a master with GTID among the Galera nodes. However, we would recommend users to configure all the MariaDB Galera nodes as masters. GTID, which is automatically enabled in MariaDB, will be used to do master failover.

The following must be true for the masters:

  • At least one master among the Galera nodes
  • All masters must be configured with the same domain ID
  • log_slave_updates must be enabled
  • All masters’ MariaDB port is accessible by ClusterControl and slaves
  • Must be running MariaDB version 10.0.2 or later

To configure a Galera node as master, change the MariaDB configuration file for that node as per below:

gtid_domain_id=<must be same across all mariadb servers participating in replication>
server_id=<must be unique>
binlog_format=ROW
log_slave_updates=1
log_bin=binlog


Preparing the Slave

For the slave, you would need a separate host or VM, with or without MariaDB installed. If you do not have MariaDB installed, and choose ClusterControl to install MariaDB on the slave, ClusterControl will perform the necessary actions to prepare the slave; configure root password (based on monitored_mysql_root_password), create slave user (based on repl_user, repl_password), configure MariaDB, start the server and finally start replication.

In short, we must perform the following actions beforehand:

  • The slave node must be accessible using passwordless SSH from the ClusterControl server
  • MariaDB port (default 3306) and netcat port 9999 on the slave are open for connections
  • You must configure the following options in the ClusterControl configuration file for the respective cluster ID under /etc/cmon.cnf or /etc/cmon.d/cmon_<cluster ID>.cnf:
    • repl_user=<the replication user>
    • repl_password=<password for replication user>
    • monitored_mysql_root_password=<the mysql root password of all nodes including slave>
  • The slave configuration template file must be configured beforehand, and must have at least the following variables defined in the MariaDB configuration template:
    • gtid_domain_id (the value must be the same across all nodes participating in the replication)
    • server_id
    • basedir
    • datadir

To prepare the MariaDB configuration file for the slave, go to ClusterControl > Manage > Configurations > Template Configuration files > edit my.cnf.slave and add the following lines:

[mysqld]
bind-address=0.0.0.0
gtid_domain_id=1
log_bin=binlog
log_slave_updates=1
expire_logs_days=7
server_id=1001
binlog_format=ROW
slave_net_timeout=60
basedir=/usr
datadir=/var/lib/mysql


Attaching a Slave via ClusterControl

Let’s now add a MariaDB slave using ClusterControl. Our example cluster is running MariaDB 10.1.2 with ClusterControl v1.2.10. Our deployment will look like this:

1. Configure Galera nodes as master. Go to ClusterControl > Manage > Configurations, and click Edit/View on each configuration file and append the following lines under mysqld directive:

mariadb1:

gtid_domain_id=1
server_id=101
binlog_format=ROW
log_slave_updates=1
log_bin=binlog
expire_logs_days=7

mariadb2:

gtid_domain_id=1
server_id=102
binlog_format=ROW
log_slave_updates=1
log_bin=binlog
expire_logs_days=7

mariadb3:

gtid_domain_id=1
server_id=103
binlog_format=ROW
log_slave_updates=1
log_bin=binlog
expire_logs_days=7

2. Perform a rolling restart from ClusterControl > Manage > Upgrades > Rolling Restart. Optionally, you can restart one node at a time under ClusterControl > Nodes > select the corresponding node > Shutdown > Execute, and then start it again.

3. On the ClusterControl node, setup passwordless SSH to the slave node:

$ ssh-copy-id -i ~/.ssh/id_rsa 10.0.0.128

4. Then, ensure the following lines exist in the corresponding cmon.cnf or cmon_<cluster ID>.cnf:

repl_user=slave
repl_password=slavepassword123
monitored_mysql_root_password=myr00tP4ssword

Restart CMON daemon to apply the changes:

$ service cmon restart

5. Go to ClusterControl > Manage > Configurations > Create New Template or Edit/View existing template, and then add the following lines:

[mysqld]
bind-address=0.0.0.0
gtid_domain_id=1
log_bin=binlog
log_slave_updates=1
expire_logs_days=7
server_id=1001
binlog_format=ROW
slave_net_timeout=60
basedir=/usr
datadir=/var/lib/mysql

6. Now, we are ready to add the slave. Go to ClusterControl > Cluster Actions > Add Replication Slave. Choose a master and the configuration file as per the example below:

Click on Proceed. A job will be triggered and you can monitor the progress at ClusterControl > Logs > Jobs. You should notice that ClusterControl will use non-GTID replication in the Jobs details:

You can simply ignore it as we will setup our MariaDB GTID replication manually later. Once the add job is completed, you should see the master and slave nodes in the grids:

At this point, the slave is replicating from the designated master using the old way (using binlog file/position). 

Replication using MariaDB GTID

Ensure the slave catches up with the master host, the lag value should be 0. Then, stop the slave on slave1:

MariaDB> STOP SLAVE;

Verify the slave status and ensure Slave_IO_Running and Slave_SQL_Running return No. Retrieve the latest values of Master_Log_File and Read_Master_Log_Pos:

MariaDB> SHOW SLAVE STATUS\G
*************************** 1. row ***************************
               Slave_IO_State:
                  Master_Host: 10.0.0.131
                  Master_User: slave
                  Master_Port: 3306
                Connect_Retry: 60
              Master_Log_File: binlog.000022
          Read_Master_Log_Pos: 55111710
               Relay_Log_File: ip-10-0-0-128-relay-bin.000002
                Relay_Log_Pos: 28699373
        Relay_Master_Log_File: binlog.000022
             Slave_IO_Running: No
            Slave_SQL_Running: No

Then on the master (mariadb1) run the following statement to retrieve the GTID:

MariaDB> SELECT binlog_gtid_pos('binlog.000022',55111710);
+-------------------------------------------+
| binlog_gtid_pos('binlog.000022',55111710) |
+-------------------------------------------+
| 1-103-613991                              |
+-------------------------------------------+

The result from the function call is the current GTID, which corresponds to the binary file position on the master. 

Set the GTID slave position on the slave node. Run the following statement on slave1:

MariaDB> STOP SLAVE;
MariaDB> SET GLOBAL gtid_slave_pos = '1-103-613991';
MariaDB> CHANGE MASTER TO master_use_gtid=slave_pos;
MariaDB> START SLAVE;

The slave will start catching up with the master using GTID as you can verify with SHOW SLAVE STATUS command:

        ...
        Seconds_Behind_Master: 384
Master_SSL_Verify_Server_Cert: No
                Last_IO_Errno: 0
                Last_IO_Error:
               Last_SQL_Errno: 0
               Last_SQL_Error:
  Replicate_Ignore_Server_Ids:
             Master_Server_Id: 101
               Master_SSL_Crl:
           Master_SSL_Crlpath:
                   Using_Gtid: Slave_Pos
                  Gtid_IO_Pos: 1-103-626963


Master Failover and Recovery

ClusterControl doesn’t support MariaDB slave failover with GTID via ClusterControl UI in the current version (v1.2.10), this will be supported in v1.2.11. So, if you are using 1.2.10 or earlier, failover has to be done manually whenever the designated master fails. Initially, when you added a replication slave via ClusterControl, it only added the slave user on the designated master (mariadb1). To ensure failover works, we have to explicitly add the slave user on mariadb2 and mariadb3.

Run following command on mariadb2 or mariadb3 once. It should replicate to all Galera nodes:

MariaDB> GRANT REPLICATION SLAVE ON *.* TO slave@'10.0.0.128' IDENTIFIED BY 'slavepassword123';
MariaDB> FLUSH PRIVILEGES;

If mariadb1 fails, to switch to another master, you just need to run following statement on slave1:

MariaDB> STOP SLAVE;
MariaDB> CHANGE MASTER TO MASTER_HOST='10.0.0.132';
MariaDB> START SLAVE;

The slave will resume from the last Gtid_IO_Pos. Check the slave status to verify everything is working:

MariaDB [(none)]> show slave status\G
*************************** 1. row ***************************
               Slave_IO_State: Waiting for master to send event
                  Master_Host: 10.0.0.132
                  Master_User: slave
                  Master_Port: 3306
                Connect_Retry: 60
              Master_Log_File: binlog.000020
          Read_Master_Log_Pos: 140875476
               Relay_Log_File: ip-10-0-0-128-relay-bin.000002
                Relay_Log_Pos: 1897915
        Relay_Master_Log_File: binlog.000020
             Slave_IO_Running: Yes
            Slave_SQL_Running: Yes
              Replicate_Do_DB:
          Replicate_Ignore_DB:
           Replicate_Do_Table:
       Replicate_Ignore_Table:
      Replicate_Wild_Do_Table:
  Replicate_Wild_Ignore_Table:
                   Last_Errno: 0
                   Last_Error:
                 Skip_Counter: 0
          Exec_Master_Log_Pos: 130199239
              Relay_Log_Space: 12574457
              Until_Condition: None
               Until_Log_File:
                Until_Log_Pos: 0
           Master_SSL_Allowed: No
           Master_SSL_CA_File:
           Master_SSL_CA_Path:
              Master_SSL_Cert:
            Master_SSL_Cipher:
               Master_SSL_Key:
        Seconds_Behind_Master: 133
Master_SSL_Verify_Server_Cert: No
                Last_IO_Errno: 0
                Last_IO_Error:
               Last_SQL_Errno: 0
               Last_SQL_Error:
  Replicate_Ignore_Server_Ids:
             Master_Server_Id: 102
               Master_SSL_Crl:
           Master_SSL_Crlpath:
                   Using_Gtid: Slave_Pos
                  Gtid_IO_Pos: 1-103-675356

That’s it! Please give it a try and let us know how these instructions worked for you.

Blog category:

Become a MySQL DBA blog series - Live Migration using MySQL Replication

$
0
0

Migrating your database to a new datacenter can be a high-risk and time-consuming process. A database contains state, and can be much harder to migrate as compared to web servers, queues or cache servers. 

In this blog post, we will give you some tips on how to migrate your data from one service provider to another. The process is somewhat similar to our previous post on how to upgrade MySQL, but there are a couple of important differences. 
 
This is the seventh installment in the ‘Become a MySQL DBA’ blog series. Our previous posts in the DBA series include Database Upgrades, Replication Topology Changes, Schema Changes, High Availability, Backup & Restore, Monitoring & Trending.

MySQL Replication or Galera?

Switching to another service provider (e.g., moving from AWS to Rackspace or from colocated servers to cloud) very often means one would build a brand new infrastructure in parallel, sync it with the old infrastructure and then switch over to it.  To connect and sync them, you may want to leverage MySQL replication. 

If you are using Galera Cluster, it might be easier to move your Galera nodes to a different datacenter. However, note that the whole cluster still has to be treated as a single database. This means that your production site might suffer from the additional latency introduced when stretching Galera Cluster over the WAN. It is possible to minimize impact by tuning network settings in both Galera and the operating system, but the impact cannot be entirely eliminated. It is also possible to set up asynchronous MySQL Replication between the old and the new cluster instead, if the latency impact is not acceptable.

Setting up secure connectivity

MySQL replication is unencrypted, and therefore not safe to use over the WAN. There are numerous ways of ensuring that your data will be transferred safely. You should investigate if it is possible to establish a VPN connection between your current infrastructure and your new service provider. Most of the providers (for example both Rackspace and AWS) provides such service - you can connect your “cloudy” part to your existing datacenter via virtual private network.

If, for some reason, this solution does not work for you (maybe it requires hardware that you do not have access to), you can use software to build a VPN - one of them will be OpenVPN. This tool will work nicely to setup encrypted connection between your datacenters.

If OpenVPN is not an option, there are more ways to ensure replication will be encrypted. For example, you can use SSH to create a tunnel between old and new datacenters, and forward the 3306 port from the current MySQL slave (or master) to the new node. It can be done in a very simple way as long as you have SSH connectivity between the hosts:

$ ssh -L local_port:old_dc_host:mysql_port_in_old_dc root@old_dc_host -N &

For example:

$ ssh -L 3307:10.0.0.201:3306 root@10.0.0.201 -N &

Now, you can connect to the remote server by using 127.0.0.1:3307

$ mysql -P3307 -h 127.0.0.1

It will work similarly for the replication, just remember to use 127.0.0.1 for the master_host and 3307 for the master_port

Last but not least you can encrypt your replication using SSL. This previous blog post explains how it can be done and what kind of impact it may have on the replication performance.

If you decided to use Galera replication across both datacenters, the above suggestions also apply here. When it comes to the SSL, we previously blogged about how to encrypt Galera replication traffic. For a more complete solution, you may want to encrypt all database connections from client applications and any management/monitoring infrastructure.

Setting up the new infrastructure

Once you have connectivity, you need to start building the new infrastructure. For that, you will probably use xtrabackup unless you are combining the migration with a MySQL upgrade. We discussed it in the previous post but it’s important enough to reiterate - if you plan to perform a major version upgrade (e.g., from MySQL 5.5 to MySQL 5.6), the only supported option is via dump and reload. Xtrabackup does a binary copy which works fine as long as we have the same MySQL version on both ends. We would not recommend performing an upgrade together with the migration. Migrating to a new infrastructure is significant enough on it’s own so combining it with another major change increases complexity and risk. That’s true for other things too - you want to take step-by-step approach to changes. Only by changing things one at a time that you can understand the results of the changes, and how they impact your workload - if you made more than one change at a given time, you cannot be sure which one is responsible for a given (new) behavior that you’ve observed.

When you have a new MySQL instance up and running in the new datacenter, you need to slave it off the node in the old datacenter - to ensure that data in both datacenters will stay in sync. This will become handy as you prepare yourself for the final cutover. It’s also a nice way of ensuring that the new environment can handle your write load. 

Next step will be to build a complete staging infrastructure in the new location and perform tests and benchmarks. This is a very important step that shouldn’t be skipped - the problem here is that you, as the DBA, have to understand the capacity of your infrastructure. When you change the provider, things also change. New hardware/vm’s are faster or slower. There’s more or less memory per instance. You need to understand again how your workload will fit in the hardware you are going to use. For that you’ll probably use Percona Playback or pt-log-player to replay some of the real life queries on the staging system. You’ll want to test the performance and ensure that it’s on a level which is acceptable for you. You also want to perform all of the standard acceptance tests that you run on your new releases - just to confirm that everything is up and running. In general, all applications should be built in a way that they do not rely on the hardware configuration and on a current setup. But something might have slipped through and your app may depend on some of the config tweaks or hardware solutions that you do not have in the new environment. 

Finally, once you are happy with your tests, you’ll want to build a production-ready infrastructure. After this is done, you may want to run some read-only tests for final verification. This would be the final step before the cutover.

Cutover

After all those tests have been performed and after the infrastructure was deemed production-ready, the last step is to cutover traffic from the old infrastructure. 

Globally speaking, this is a complex process but when we are looking at the database tier, it’s more or less the same thing as standard failover - something that you may have done multiple times in the past. We covered it in details in an earlier post, in short the steps are: stop the traffic, ensure it’s stopped, wait while the application is being moved to the new datacenter (DNS records change or what not), do some smoke tests to ensure all looks good, go live, monitor closely for a while.

This cutover will require some downtime, as we can see. The problem is to make sure we have consistent state across the old site and the new one. If we want to do it without downtime, then we would need to set up master-master replication. The reason is that as we refresh DNS and move over sessions from the old site to the new one, both systems will be in use at the same time - until all sessions are redirected to the new site. In the meantime, any changes on the new site need to be reflected on the old site. 

Using Galera Cluster as described in this blog post can also be a way to keep data between the two sites in sync. 

We are aware this is a very brief description of the data migration process. Hopefully, it will be enough to point you into a good direction and help you identify what additional information you need to look for. 

Related Resources

Webinar Replay: Migrating to MySQL, MariaDB Galera and/or Percona XtraDB Cluster

Blog category:

Architecting for Failure - Disaster Recovery of MySQL/MariaDB Galera Cluster

$
0
0

Failure is a fact of life, and cannot be avoided. No IT vendor in their right mind will claim 100% system availability, although some might claim several nines :-) We might have armies of ops soldiers doing everything they possibly can to avoid failure, yet we still need to prepare for it. What do you do when the sh*t hits the fan?

Whether you use unbreakable private datacenters or public cloud platforms, Disaster Recovery (DR) is indeed a key issue. This is not about copying your data to a backup site and being able to restore it, this is about business continuity and how fast you can recover services when disaster strikes. 

In this blog post, we will look into different ways of designing your Galera Clusters for fault tolerance, including failover and failback strategies. 

Disaster Recovery (DR)

Disaster recovery involves a set of policies and procedures to enable the recovery or continuation of infrastructure following a natural or human-induced disaster. A DR site is a backup site in another location where an organization can relocate following a disaster, such as fire, flood, terrorist threat or other disruptive event. A DR site is an integral part of a Disaster Recovery/Business Continuity plan.

Most large IT organizations have some sort of DR plan, not so for smaller organisations though - because of the high cost vs the relative risk. Thanks to the economics of public clouds, this is changing though. Smaller organisations with tighter budgets are also able to have something in place. 

Setting up Galera Cluster for DR Site

A good DR strategy will try to minimize downtime, so that in the event of a major failure, a backup site can instantly take over to continue operations. One key requirement is to have the latest data available. Galera is a great technology for that, as it can be deployed in different ways - one cluster stretched across multiple sites, multiple clusters kept in sync via asynchronous replication, mixture of synchronous and asynchronous replication, and so on. The actual solution will be dictated by factors like WAN latency, eventual vs strong data consistency and budget.
 
Let’s have a look at the different options to deploy Galera and how this affects the database part of your DR strategy. 

Active Passive Master-Master Cluster

This consists of 6 Galera nodes on two sites, forming a Galera cluster across WAN. You would need a third site to act as an arbitrator, voting for quorum and preserving the “primary component” if the primary site is unreachable. The DR site should be available immediately, without any intervention.

Failover strategy:

  1. Redirect your traffic to the DR site (e.g. update DNS records, etc.). The assumption here is that the DR site’s application instances are configured to access the local database nodes.

Failback strategy:

  1. Redirect your traffic back to primary site.

Advantages:

  • Failover and failback without downtime. Applications can switch to both sites back and forth.
  • Easier to switch side without extra steps on re-bootstrapping and reprovisioning the cluster. Both sites can receive reads/writes at any moment provided the cluster is in quorum.
  • SST (or IST) during failback won’t be painful as a set of nodes is available to serve the joiner on each site.

Disadvantages:

  • Highest cost. You need to have at least three sites with minimum of 7 nodes (including garbd). 
  • With the disaster recovery site mostly inactive, this would not be the best utilisation of your resources.
  • Requires low and reliable latency between sites, or else there is a risk for lag - especially for large transactions (even  with different segment IDs assigned)
  • Risk for performance degradation is higher with more nodes in the same cluster, as they are synchronous copies. Nodes with uniform specs are required.
  • Tightly coupled cluster across both sites. This means there is a high level of communication between the two sets of nodes, and e.g., a cluster failure will affect both sites. (on the other hand, a loosely coupled system means that the two databases would be largely independent, but with occasional synchronisation points)

Active Passive Master-Master Node

Two nodes are located in the primary site while the third node is located in the disaster recovery site. If the primary site is down, the cluster will fail as it is out of quorum. galera3 will need to be bootstrapped manually as a single node primary component. Once the primary site comes back up, galera 1 and galera2 need to rejoin galera3 to get synced. Having a pretty large gcache should help to reduce the risk of SST over WAN.

Failover strategy:

  1. Bootstrap galera3 as primary component running as “single node cluster”.
  2. Point database traffic to the DR site.

Failback strategy:

  1. Let galera1 and galera2 join the cluster.
  2. Once synced, point database traffic to the primary site.

Advantages:

  • Reads/writes to any node.
  • Easy failover with single command to promote the disaster recovery site as primary component.
  • Simple architecture setup and easy to administer.
  • Low cost (only 3 nodes required)

Disadvantages:

  • Failover is manual, as the administrator needs to promote the single node as primary component. There would be downtime in the meantime.
  • Performance might be an issue, as the DR site will be running with a single node to run all the load. It may be possible to scale out with more nodes after switching to the DR site, but beware of the additional load.
  • Failback will be harder if SST happens over WAN.
  • Increased risk, due to tightly coupled system between the primary and DR sites

Active Passive Master-Slave Cluster via Async Replication

This setup will make the primary and DR site independent of each other, loosely connected with asynchronous replication. One of the Galera nodes in the DR site will be a slave, that replicates from one of the Galera nodes (master) in the primary site. Ensure that both sites are producing binary logs with GTID and log_slave_updates is enabled - the updates that come from the asynchronous replication stream will be applied to the other nodes in the cluster.

By having two separate clusters, they will be loosely coupled and not affect each other. E.g. a cluster failure on the primary site will not affect the backup site. Performance-wise, WAN latency will not impact updates on the active cluster. These are shipped asynchronously to the backup site. The DR cluster could potentially run on smaller instances in a public cloud environment, as long as they can keep up with the primary cluster. The instances can be upgraded if needed. 

It’s also possible to have a dedicated slave instance as replication relay, instead of using one of the Galera nodes as slave.

Failover strategy:

  1. Ensure the slave in the DR site is up-to-date (up until the point when the primary site was down).
  2. Stop replication slave between slave and primary site. Make sure all replication events are applied.
  3. Direct database traffic on the DR site.

Failback strategy:

  1. On primary site, setup one of the Galera nodes (e.g., galera3) as slave to replicate from a (master) node in the DR site (galera2).
  2. Once the primary site catches up, switch database traffic back to the primary cluster.
  3. Stop the replication between primary site and DR site.
  4. Re-slave one of the Galera nodes on DR site to replicate from the primary site.

Advantages:

  • No downtime required during failover/failback.
  • No performance impact on the primary site since it is independent from the backup site.
  • Disaster recovery site can be used for other purposes like data backup, binary logs backup and reporting or large analytical queries (OLAP).

Disadvantages:

  • There is a chance of missing some data during failover if the slave was behind.
  • Pretty costly, as you have to setup a similar number of nodes on the disaster recovery site.
  • The failback strategy can be risky, it requires some expertise on switching master/slave role.

Active Passive Master-Slave Replication Node

Galera cluster on the primary site replicates to a single-instance slave in the DR site using asynchronous MySQL replication with GTID. Note that MariaDB had a different GTID implementation, so it has slightly different instructions. 
Take extra precaution to ensure the slave is replicating without replication lag, to avoid any data loss during failover. From the slave point-of-view, switching to another master should be easy with GTID.

Failover to DR site:

  1. Ensure the slave has caught up with the master. If it does not and the primary site is already down, you might miss some data. This will make things harder.
  2. If the slave has READ_ONLY=on, disable it so it can receive writes.
  3. Redirect database traffic to the DR site

Failback to primary site:

  1. Use xtrabackup to move the data from the DR site to a Galera node on primary site - this is online process which may cause some performance drops but it’s non-blocking for InnoDB-only databases
  2. Once data is in place, slave the Galera node off the DR host using the data from xtrabackup
  3. At the same time, slave the DR site off the Galera node - to form master-master replication
  4. Rebuild the rest of the Galera cluster using either xtrabackup or SST
  5. Wait until primary site catches up on replication with DR site
  6. Perform a failback by stopping the writes to DR, ensure that replication is in sync and finally repoint writes to the production
  7. Set the slave as read-only, stop the replication from DR to prod leaving only prod -> DR replication

Advantages:

  • Replication slave should not cause performance impact to the Galera cluster.
  • If you are using MariaDB, you can utilize multi-source replication, where the slave in the DR site is able to replicate from multiple masters.
  • Lowest cost and relatively faster to deploy.
  • Slave on disaster recovery site can be used for other purposes like data backup, binary logs backup and running huge analytical queries (OLAP).

Disadvantages:

  • There is a chance of missing data during failover if the slave was behind.
  • More hassle in failover/failback procedures.
  • Downtime during failover.

The above are a few options for your disaster recovery plan. You can design your own, make sure you perform failover/failback tests and document all procedures. Trust us - when disaster strikes, you won’t be as cool as when you’re reading this post.

Blog category:

Become a MySQL DBA blog series - Configuration Tuning for Performance

$
0
0

A database server needs CPU, memory, disk and network in order to function. Understanding these resources is important for a DBA, as any resource that is weak or overloaded can become a limiting factor and cause the database server to perform poorly. A main task of the DBA is to tune operating system and database configurations and avoid overutilization or underutilization of the available resources.

In this blog post, we’ll discuss some of the settings that are most often tweaked and which can bring you significant improvement in the performance. We will also cover some of the variables which are frequently modified even though they should not. Performance tuning is not easy, but you can go a surprisingly long way with a few basic guidelines.
 
This is the eighth installment in the ‘Become a MySQL DBA’ blog series. Our previous posts in the DBA series include Live Migration using MySQL Replication, Database Upgrades, Replication Topology Changes, Schema Changes, High Availability, Backup & Restore, Monitoring & Trending.

Performance tuning - a continuous process

Installing MySQL is usually the first step in the process of tuning both OS and database configurations. This is a never-ending story as a database is a dynamic system. Your MySQL database can be CPU-bound at first, as you have plenty of memory and little data. With time, though, it may change and disk access may become more frequent. As you can imagine, the configuration of a server where I/O is the main concern will look different to that of a server where all data fits in memory. Additionally, your query mix may also change in time and as such, access patterns or utilization of the features available in MySQL (like adaptive hash index), can change with it.

What’s also important to keep in mind is that, most of the time, tweaks in MySQL configuration will not give you significant difference in performance. There are couple of exceptions but you should not expect anything like 10x improvement or something similar. Adding a correct index may help you much more than tweaking your my.cnf. 

The tuning process

Let’s start with a description of the tuning process.

To begin, you would need a deterministic environment to test your changes and observe results. The environment should be as close to production as possible. By that we mean both data and traffic. For safety reasons you should not implement and test changes directly on the production systems. It’s also much easier to make changes in the testing environment - some of the tweaks require MySQL to restart - this is not something you can do on production.

Another thing to keep in mind - when you make changes, it is very easy to lose track of which change affected your workload in a particular way. People tend to take shortcuts and make multiple tweaks at the same time - it’s not the best way. After implementing multiple changes at the same time, you do not really know what impact each of them had. The result of all the changes is known but it’s not unlikely that you’d be better off implementing only one of the five changes you made.

After each config change, you also want to ensure your system is in the same state - restore the data set to a known (and always the same) position - e.g., you can restore your data from a given backup. Then you need to run exactly the same query mix to reproduce the production workload - this is the only way to ensure that your results are meaningful and that you can reproduce them. What’s also important is to isolate the testing environment from the rest of your infrastructure so your results won’t be affected by external factors. This means that you do not want to use VMs located on a shared host as other VMs may impact your tests. The same is true for storage - shared SAN may cause some unexpected results.

OS tuning

You’ll want to check operating system settings related to the way the memory and filesystem cache are handled. In general, we want to keep both vm.dirty_ratio and vm.dirty_background_ratio low.

vm.dirty_background_ratio is the percentage of system memory that can be used to cache modified (“dirty”) pages before the background flush process kicks in. More of them means more work needs to be done in order to clean the cache. 

vm.dirty_ratio, on the other hand, is a hard limit of the memory that can be used to cache dirty pages. It can be reached if, due to high write activity, the background process cannot flush data fast enough to keep up with new modifications. Once vm.dirty_ratio is reached, all I/O activity is locked until dirty pages have been written to disk. Default setting here is usually 40% (it may be different in your distribution), which is pretty high for any host with large memory. Let’s say that for a 128GB instance, it amounts to ~51GB which may lock your I/O for a significant amount of time, even if you are using fast SSD’s.

In general, we want to see both of those variables set to low numbers, 5 - 10%, as we want background flushing to kick in early on and to keep any stalls as short as possible.

Another important system variable to tune is vm.swappiness. When using MySQL we do not want to use swap unless in dire need - swapping out InnoDB buffer pool to disk removes a point of having an in-memory buffer pool. On the other hand, if the alternative is to start OOM and kill MySQL, we’d prefer not to do that. Historically, such behavior could have been achieved by setting vm.swappiness to 0. Since kernel 3.5-rc1 (and this change has been backported to older kernels in some of the distros - CentOS for example), this behavior has changed and setting it to 0 prevents swapping. Therefore it’s recommended to set vm.swappiness to 1, to allow some of the swapping to happen should it be the only option to keep MySQL up. Sure, it will slow down the system but OOM on MySQL is very harsh. It may result in data loss (if you do not run with full durability settings) or, in the best case scenario, trigger InnoDB recovery, a process which may take some time to complete.

Another memory-related setting - ensure that you have NUMA interleave set to all. You can do it by modifying the startup script to start MySQL via:

numactl --interleave=all $command

This setting balances memory allocation between NUMA nodes and minimizes chances that one of the nodes go out of memory.

Memory allocators can also have a significant impact on MySQL performance. This is a larger topic and we’ll only scratch the surface here. You can choose different memory allocators to use with MySQL. Their performance differ between the versions and between workloads so the exact choice should be made only after you performed detailed tests to confirm which one works best in your environment. Most common choices you’ll be looking into are default glibc malloc, tcmalloc and jemalloc. You can add new allocators by installing a new package (for jemalloc and tcmalloc) and then use either LD_PRELOAD (i.e. export LD_PRELOAD="/usr/lib/libtcmalloc_minimal.so.4.1.2") or malloc-lib variable in [mysqld_safe] section of my.cnf.

Next, you’d want to take a look at disk schedulers. CFQ, which is usually the default one, is tuned for a desktop workload. It doesn’t work well for a database workload. Most of the time you’ll see better results if you change it to noop or deadline. There’s little difference between those two schedulers, we found that noop is slightly better for storage based on SAN (SAN usually is better in handling the workload as it knows more about the underlying hardware and what’s actually stored in its cache as compared to the operating system). Differences are minimal, though, and most of the time you won’t go wrong by using any of those options. Again, testing may help you squeeze a bit more from your system.

If we are talking about disks, most often the best choice for filesystem will be either EXT4 or XFS - this has changed a couple of times in the past, and if you’d like to get the most of your I/O subsystem, you’d probably have to do some testing on your setup. No matter which filesystem you use though, you should disable noatime and nodiratime for the MySQL volume - the less writes to the metadata, the lower the overall overhead.

MySQL configuration tuning

MySQL configuration tuning is a topic for a whole book, it’s not possible to cover it in a single blog post. We’ll try to mention some of the more important variables here.

InnoDB Buffer Pool

Let’s start with something rather obvious - InnoDB buffer pool. We still see, from time to time (although it becomes less and less frequent, which is really nice), that it’s not setup correctly. Defaults are way too conservative. What is the buffer pool and why is it so important? The buffer pool is memory used by InnoDB to cache data. It is used for caching both reads and writes - every page that has been modified, had to be loaded first to the buffer pool. It then becomes a dirty page - a page that has been modified and is not yet flushed to the tablespace. As you can imagine, such buffer is really important for a database to perform correctly. The worse the “memory/disk” ratio is, the more I/O bound your workload will be. I/O bound workloads tend to be slow.

You may have heard the rule of thumb to set the InnoDB buffer pool to 80% of the total memory in the system. It worked in times when 8GB was a huge amount of memory, but that is not true nowadays. When calculating the InnoDB buffer pool size, you need to take into consideration memory requirements of the rest of MySQL (assuming that MySQL is the only application running on the server). We are talking here, for example, about all those per-connection or even per-query buffers like join buffer or in-memory temporary table max size. You also need to take under consideration maximum allowed connections - more connections means more memory usage.

For a MySQL database server with 24 to 32 cores and 128GB memory, handling up to 20 - 30 of simultaneous running connections and up to a few hundreds of simultaneously connected clients, we’d say that 10 - 15GB of memory should be enough. If you want to stay on the safe side, 20GB should be plenty. In general, unless you know the behaviour of your database, it’s somewhat a process of trial and error to set up ideal buffer pool size. At the moment of writing, InnoDB buffer pool is not a dynamic variable so changes require restart. Therefore it is safer to err on the side of “too small”. It will change with MySQL 5.7 as Oracle introduced dynamically allocated buffer pool, something which will make tuning much easier.

MySQL uses many buffers other than the InnoDB buffer pool - they are controlled by variables: join_buffer_size, sort_buffer_size, read_buffer_size, read_rnd_buffer_size. These buffers are allocated per-session (with an exception of the join buffer, which is allocated per JOIN). We’ve seen MySQL with those buffers set to hundreds of megabytes - it’s somewhat natural that by increasing join_buffer_size, you’d expect your JOINs to perform faster.

By default those variables have rather small values and it actually makes sense - we’ve seen that low settings, up to 256K, can be significantly faster than larger values like for example 4M. It is hard to tell the exact reason for this behavior, most likely there are many of them. One, definitely, is the fact that Linux changes the way memory is allocated. Up to 256KB it uses malloc(). For larger chunks of memory - mmap(). What’s important to remember is that when it comes to those variables, any change has to be backed by benchmarks that confirm the new setting is indeed the correct one. Otherwise you may be reducing your performance instead of increasing it.

InnoDB Durability

Another variable that has a significant impact on the MySQL performance is innodb_flush_log_at_trx_commit. It’s governing to what extend InnoDB is durable. Defaults (1) ensure your data is safe even if the database server gets killed - under any circumstances there’ll be no data loss. Other settings (2 and 0) say that you may lose up to 1s of transactions if the whole database server crashes (2) and that you may lose up to 1s of transactions if the mysqld gets killed.

Full durability is obviously a great thing to have but it comes at a significant price - I/O load is much higher because the flush operation has to happen after each commit. Therefore, under some circumstances, it’s very popular to reduce durability and accept the risk of data loss in certain conditions. It’s true for master - multiple slaves setups where, usually, it’s perfectly fine to have one slave in the rebuild process after a crash because the rest of them can easily handle the workload. Same is true for Galera clusters - the whole cluster works as a single instance so even if one node crashes and somehow loses its data, it still can resync from another node in the cluster - it’s not worth paying the high price for full durability (especially that writes in Galera are already more expensive than in regular MySQL) when you can easily recover from such situations. 

I/O-related settings

Other variables which may have significant impact on some workloads are innodb_io_capacity, innodb_io_capacity_max and innodb_lru_scan_depth. Those variables define the number of disk operations that can be done by InnoDB’s background threads to, e.g., flush dirty pages from the InnoDB buffer pool. Default settings are conservative, which is fine most of the time. If your workload is very write-intensive, you may want to tune those settings and see if you are not preventing InnoDB from using your I/O subsystem fully. This is especially true if you have fast storage: SSD or PCIe SSD card.

When it comes to disks, innodb_flush_method is another setting that you may want to look at. We’ve seen visible performance gains by switching this setting from default fdatasync to O_DIRECT. Such gain is clearly visible on setups with hardware RAID controller which is backed up by the BBU. On the other hand, when it comes to EBS volumes, we’ve seen better results using O_DSYNC. Benchmarking here is very important to understand which setting would be better in your particular case.

InnoDB Redo Logs

The size of InnoDB’s redo logs is also something you may want to take a look at. It is governed by innodb_log_file_size and innodb_log_files_in_group. By default we have two logs in a group, each ~50MB in size. Those logs are used to store write transactions and they are written sequentially. The main problem here is that MySQL must not run out of space in the logs and if logs are almost full, it will have to stop the whole activity and focus on flushing the data to the tablespaces. Of course, this is very bad for the application as no writes can happen during this time. This is one of the reasons why InnoDB I/O settings, that we discussed above, are very important. We can also help by increasing the redo log size by changing innodb_log_file_size. The rule of thumb is to set them large enough to cover at least 1h of writes. We discussed InnoDB I/O settings in more details in an earlier post, where we also covered a method for calculating InnoDB redo log size.

Query Cache

MySQL query cache is also often “tuned” - this cache stores hashes of the SELECT statements and their results. There are two problems with it - first one, the cache may be frequently flushed. If any DML was executed against a given table, all results related to this table are removed from the query cache. This seriously impacts the usefulness of the MySQL query cache. Second problem is that the query cache is protected by a mutex and access is serialized. This is a significant drawback and limitation for any workload with higher concurrency. Therefore it is strongly recommended to “tune” MySQL query cache by disabling it altogether. You can do it by setting query_cache_type to OFF. It’s true that in some cases it can be of some use, but most of the time it’s not. Instead of relying on MySQL query cache, you can also leverage any other external systems like Memcached or Redis to cache data.

Internal contention handling

Another set of settings that you may want to look at are variables that control how many instances/partitions of a given structure that MySQL should create. We are talking here about the variables: innodb_buffer_pool_instances, table_open_cache_instances, metadata_locks_hash_instances and innodb_adaptive_hash_index_partitions. Those options were introduced when it became clear that, for example, a single buffer pool or single adaptive hash index can become a point of contention for workloads with high concurrency. Once you find out that one of those structures becomes a pain point (we discussed how you can catch these situations in an earlier blog post) you’ll want to adjust the variables. Unfortunately, there are no rules of thumb here. It’s suggested that a single buffer pool instance should be at least 2GB in size, so for smaller buffer pools you may want to stick to this limit. In case of the other variables, if we are talking about issues with contentions, you will probably increase the number of instances/partitions of those data structures, but there are no rules on how to do that - you need to observe your workload and decide at which point contention is no longer an issue.

Other settings

There are a few other settings you may want to look at, some are applicable in the most efficient way at the setup time. Some can be changed dynamically. Those settings won’t have a large impact on the performance (sometimes the impact may also be negative one), but it is still important to keep them in mind. 

max_connections - on one hand you want to keep it high enough to handle any incoming connections. On the other hand, you don’t want to keep it too high as most of the servers are not able to handle hundreds or more connections simultaneously. One way of going around this problem is to implement connection pooling on the application side, or e.g. using a load balancer like HAProxy to throttle the load.

log_bin - if you are using MySQL replication, you need to have binary logs enabled. Even if you do not use them, it’s very handy to keep them enabled as they can be used to do a point-in-time recovery.

skip_name_resolve - this variable decides whether DNS lookup is performed on the host that is a source of incoming connection. If enabled, FQDNs can be used in MySQL grants as host. If it’s not, only users defined with IP addresses as host will work. The problem of having DNS lookup enabled is that it can introduce extra latency. DNS servers can also stop responding (because of a crash or network issues) and in such case MySQL won’t be able to accept any new connections.

innodb_file_per_table - this variable decides if InnoDB tables are to be created in a separate tablespace (when set to 1) or in the shared tablespace (when set to 0). It’s much easier to manage MySQL when each of the InnoDB tables has a separate tablespace. For example, with separate tablespaces you can easily reclaim disk space by dropping the table or partition. With shared tablespace it doesn’t work - the only way of reclaiming the disk space is to dump the data, clean the MySQL data directory and then reload the data again. Obviously, this is not convenient.

That is it for now. As we mentioned at the beginning, tweaking those settings might not make your MySQL database blazing fast - you are more likely to speed it up by tuning your queries. But they should still have visible impact on the overall performance. Good luck with the tuning work!

Related resources


Blog category:

Become a MySQL DBA - Webinar Series: Schema Changes for MySQL Replication & Galera Cluster

$
0
0

With the rise of agile development methodologies, more and more systems and applications are built in series of iterations. This is true for the database schema as well, as it has to evolve together with the application. Unfortunately, schema changes and databases do not play well together. Changes usually require plenty of advance scheduling, and can be disruptive to your operations. 

In this new webinar, we will discuss how to implement schema changes in the least impacting way to your operations and ensure availability of your database. We will also cover some real-life examples and discuss how to handle them.

DATE & TIME

Europe/MEA/APAC
Tuesday, August 25th at 09:00 BST / 10:00 CEST (Germany, France, Sweden)
Register Now

North America/LatAm
Tuesday, August 25th at 09:00 Pacific Time (US) / 12:00 Eastern Time (US)
Register Now

AGENDA

  • Different methods to perform schema changes on MySQL Replication and Galera
    • rolling schema change
    • online alters
    • external tools, e.g., pt-online-schema-change
  • Differences between MySQL 5.5 and 5.6
  • Differences between MySQL Replication vs Galera
  • Example real-life scenarios with MySQL Replication and Galera setups

osc2_mysqll.png

SPEAKER

Krzysztof Książek, Senior Support Engineer at Severalnines, is a MySQL DBA with experience managing complex database environments for companies like Zendesk, Chegg, Pinterest and Flipboard. This webinar builds upon recent blog posts and related webinar series by Krzysztof on how to become a MySQL DBA.

We look forward to “seeing” you there and to insightful discussions!

Blog category:

Become a MySQL DBA blog series - The Query Tuning Process

$
0
0

Query tuning is something that a DBA does on a daily basis - analyse queries and updates, how these interact with the data and schema, and optimize for performance. This is an extremely important task as this is where database performance can be significantly improved - sometimes by orders of magnitude. 

In the next few posts, we will cover the basics of query tuning - indexing, what types of queries to avoid, optimizer hints, EXPLAIN and execution plans, schema tips, and so on. We will start, though, by discussing the process of query review - how to gather data and which methods are the most efficient.

This is the ninth installment in the 'Become a MySQL DBA' blog series. Our previous posts in the DBA series include Configuration Tuning, Live Migration using MySQL Replication, Database Upgrades, Replication Topology Changes, Schema Changes, High Availability, Backup & Restore, Monitoring & Trending.

Data gathering

There are a couple of ways to grab information about queries that are executed on the database. MySQL itself provides three ways - general log, binlog and slow query log.

General log

General log is the least popular way as it causes significant amount of logging and has a high impact on the overall performance (Thanks to PavelK for correcting us in the comments section). It does, though, store data about queries that are being executed, together with all the needed information to assess how long a given query took.

                   40 Connect   root@localhost on sbtest
                   40 Query     set autocommit=0
                   40 Query     set session read_buffer_size=16384
                   40 Query     set global read_buffer_size=16384
                   40 Query     select count(*) from sbtest.sbtest3 where pad like '6%'
150812  7:37:42    40 Query     select count(*) from sbtest.sbtest3 where pad like '6%'
150812  7:41:45    40 Query     select count(*) from sbtest.sbtest3 where pad like '6%'
150812  7:45:46    40 Query     select count(*) from sbtest.sbtest3 where pad like '6%'
150812  7:49:56    40 Query     select count(*) from sbtest.sbtest3 where pad like '6%'
150812  7:54:08    40 Quit

Given the additional impact, the general log is not really a feasible way of collecting slow queries, but it still can be a valid source if you have it enabled for some other reason.

Binary log

Binary logs store all modifications that were executed on the database - this is used for replication or for point-in-time recovery. There’s no reason, though, why you couldn’t use this data to check the performance of the DML's - as long as the query has been logged in the original format. This means that you should be ok for the majority of the writes as long as binlog format is set to ‘mixed’. Even better would be to use the ‘statement’ format, but it’s not recommended due to possible issues with data consistency between the nodes. The main difference between ‘statement’ and ‘mixed’ formats is that in ‘mixed’ format, all queries which might cause inconsistency will be logged in a safe, ‘row’ format. This format, though, doesn’t preserve the original query statement and so the data cannot be used for a query review.

If requirements are fulfilled, binary logs will give us enough data to work on - the exact query statement and time taken to execute it on the master. Note that this is not a very popular way of collecting the data. It has it’s own uses, though. For example, if we are concerned about the write traffic, using binary logs is a perfectly valid way of getting the data, especially if they are already enabled.

Slow query log

The slow query log is probably the most common source of information for slow queries. It was designed to log the most important information about the queries - how long they took, how many rows were scanned, how many rows were sent to the client.

Slow query log can be enabled by setting the slow_query_log variable to 1. It’s location can be set using slow_query_log_file variable. Another variable, long_query_time, sets the threshold above which queries are being logged. By default it’s 10 seconds which means queries that execute under 10 seconds will not be logged. This variable is dynamic, you can change it at any time. If you set it to 0, all queries will be logged into a slow log. It is possible to use fractions when setting long_query_time so settings like 0.1 or 0.0001 are valid ones.

What you need to remember when dealing with long_query_time is that it’s change on a global level affects only new connections. When changing it in a session, it affects the current session only (as one would expect). If you use some kind of connection pooling, this may become a significant issue. Percona Server has an additional variable, slow_query_log_use_global_control, which eliminates this drawback - it made possible to make long_query_time (and a couple of other slow log related settings that were introduced in Percona Server) truly a dynamic variable, affecting also currently open sessions.

Let’s take a look at the content of the slow query log:

# Time: 150812  8:25:19
# User@Host: root[root] @ localhost []  Id:    39
# Schema: sbtest  Last_errno: 0  Killed: 0
# Query_time: 238.396414  Lock_time: 0.000130  Rows_sent: 1  Rows_examined: 59901000  Rows_affected: 0
# Bytes_sent: 69
SET timestamp=1439367919;
select count(*) from sbtest.sbtest3 where pad like '6%';

In this entry we can see information about the time when the query was logged, the user who executed the query, thread id inside MySQL (something you’d see as Id in your processlist output), current schema, whether it failed with some error code or whether it was killed or not. Then we have the most interesting data: how long it took to execute this query, how much of this time was spent on row level locking, how many rows were sent to the client, how many rows were scanned in MySQL, how many rows were modified by the query. Finally we have info on how many bytes were sent to the client, timestamp of the time when the query was executed and the query itself.

This gives us a pretty good idea of what may be wrong with the query. Query_time is obvious - the longer a query takes to execute, the more impact on the server it will have. But there are also other clues. For example, if we see that the number of rows examined is high compared to the rows sent, it may mean that the query is not indexed properly and it’s scanning much more rows that it should be. High lock time can be a hint that we are suffering from row level locking contention. If a query had to wait some time to grab all the locks it needed, something is definitely not right. It could be that some other long running query already acquired some of the locks needed, it could be that there are long-running transactions that stay open and do not release their locks. As you can see, even such simple information may be of a great value for a DBA.

Percona Server can log some additional information into the slow query log - you can manage what’s being logged by using variable log_slow_verbosity. Below is a sample of such data:

# Time: 150812  9:41:32
# User@Host: root[root] @ localhost []  Id:    44
# Schema: sbtest  Last_errno: 0  Killed: 0
# Query_time: 239.092995  Lock_time: 0.000085  Rows_sent: 1  Rows_examined: 59901000  Rows_affected: 0
# Bytes_sent: 69  Tmp_tables: 0  Tmp_disk_tables: 0  Tmp_table_sizes: 0
# InnoDB_trx_id: 13B08
# QC_Hit: No  Full_scan: Yes  Full_join: No  Tmp_table: No  Tmp_table_on_disk: No
# Filesort: No  Filesort_on_disk: No  Merge_passes: 0
#   InnoDB_IO_r_ops: 820579  InnoDB_IO_r_bytes: 13444366336  InnoDB_IO_r_wait: 206.397731
#   InnoDB_rec_lock_wait: 0.000000  InnoDB_queue_wait: 0.000000
#   InnoDB_pages_distinct: 65314
SET timestamp=1439372492;
select count(*) from sbtest.sbtest3 where pad like '6%';

As you can see, we have all the data from the default settings and much more. We can see if a query created temporary tables, how many in total and how many of them were created on disk. We can also see the total size of those tables. This data gives us important insight - are temporary tables an issue or not? Small temporary tables may be fine, larger ones can significantly impact overall performance. Next, we see some characteristics of the query - did it use query cache, did it make a full table scan? Did it make a join without using indexes? Did it run a sort operation? Did it use disk for the sorting? How many merge passes the filesort algorithm had to do?

Next section contains information about InnoDB - how many read operations it had to do? How many bytes of data it read, how much time MySQL spend on waiting for InnoDB I/O activity, row lock acquisition or waiting in the queue to start being processed by InnoDB? We can also see the approximate number of unique pages that the query accessed. Finally, we see the timestamp and the query itself.

This additional information is useful to pinpoint the problem with a query. By looking at our example it’s clear that the query does not use any index and it makes a full table scan. By looking at the InnoDB data we can confirm that the query did a lot of I/O - it scanned ~13G of data. We can also confirm that the majority of the query execution time (239 seconds) was spent on InnoDB I/O (InnoDB_IO_r_wait - 206 seconds).

Impact of the slow log on the performance

The slow log is definitely a great way of collecting data about the performance of the queries. Unfortunately, it comes at a price - enabling slow query log enables some additional load on MySQL - a load that impacts the overall performance. We are talking here about both throughput and stability, we do not want to see drops in performance as they don’t play well with user experience and may cause some additional problems by causing temporary pileups in queries, scanned rows etc.

We’ve prepared a very simple and generic benchmark to show you the impact of the different slow log verbosity. We’ve set up a m4.xlarge instance on AWS and we used sysbench to build a single table. The workload is two threads (m4.xlarge has four cores), it’s read-only and the data set fits in the memory - we have here a very simple CPU-bound workload. Below is the exact sysbench command:

sysbench \
--test=/root/sysbench/sysbench/tests/db/oltp.lua \
--num-threads=2 \
--max-requests=0 \
--max-time=600 \
--mysql-host=localhost \
--mysql-user=sbtest \
--mysql-password=sbtest \
--oltp-tables-count=1 \
--oltp-read-only=on \
--oltp-index-updates=200 \
--oltp-non-index-updates=10 \
--report-interval=1 \
--oltp-table-size=800000 \
run

We used four verbosity stages for the slow log:

  • disabled
  • enabled, no Percona Server features
  • enabled, log_slow_verbosity='full'
  • enabled, log_slow_verbosity='full,profiling_use_getrusage,profiling'

The last one adds profiling information for a query - time spent in each of the states it went through and overall CPU time used for it. Here are the results:

As you can see, throughput-wise, impact is not that bad, except for the most verbose option. Unfortunately, it’s not a stable throughput - as you can see there are many periods when no transaction was executed - it’s true for all runs with slow log enabled. This is a significant drawback of using slow log to collect the data - if you are ok with some impact, that’s a great tool. If not, we need to look for an alternative. Of course, this is a very generic test and your mileage may vary - impact may depends on so many factors: CPU utilization, I/O throughput, number of queries per second, exact query mix etc. If you are interested in checking the impact on your system, you need to perform tests on your own.

Using tcpdump to grab the data

As we have seen, using slow log, while allowing you to collect a great deal of information, significantly impacts the throughput of the server. That’s why yet another way of collecting the data was developed. The idea is simple - MySQL sends the data over the network so all queries are there. If you capture the traffic between the application and the MySQL server, you’ll have all the queries exchanged during that time. You know when a query started, you know when a given query finished - this allows you to calculate the query’s execution time.

Using the following command you can capture the traffic hitting port 3306 on a given host.

tcpdump -s 65535 -x -nn -q -tttt -i any -c 1000 port 3306 > mysql.tcp.txt

Of course, it still causes some performance impact, let’s compare it with a clean server, no slow log enabled:

As you can see, total throughput is lower and spiky but it’s somewhat more stable than when slow log is enabled. What’s more important, tcpdump can be executed on a MySQL host but it can also be used on a proxy node (you may need to change the port in some cases), to ease the load on the MySQL node itself. In such case the performance impact will be even lower. Of course, tcpdump can’t provide you with such detailed informations as the query log does - all you can grab is a query itself and amount of data sent from the server to the client. There’s no info about rows scanned or sent, there’s no info if a query created a temporary table or not, nothing - just the execution time and query size.

Given the fact that both main methods, slow log and tcpdump, have their pros and cons, it’s common to combine them. You can use long_query_time to filter out most of the queries and log only the slowest ones. You can use tcpdump to collect the data on a regular basis (or even all the time) and use slow log in some particular cases, if you find an intriguing query. You can use data from the slow log only for thorough query reviews that happen couple of times during a year and stick to tcpdump on a daily basis. Those two methods complement each other and it’s up to a DBA to decide how to use them.

Once we have data captured using any of the methods described in this blog post, we need to process it. While data in the log files can be easily read by a human, and also it’s not a rocket science to print and parse data captured by a tcpdump, it’s not really the way you’d like to approach the query review - it’s definitely too hard to get the total picture and there’s too much noise. You need something that will aggregate information you collected and present you a nice summary. We’ll discuss such a tool in next post in this series.


Blog category:


Howto: Online Upgrade of Galera Cluster to MySQL 5.6

$
0
0

Oracle released a GA version of MySQL 5.6 in February 2013, Codership released the first GA in their patched 5.6 series in November 2013. Galera Cluster for MySQL 5.6 has been around for almost 2 years now, so what are you waiting for? :-)

Okay, this is a major upgrade so there are risks! Therefore, an upgrade must be carefully plan and tested. In this blog post, we’ll look into how to perform an online upgrade of your Galera Cluster (the Codership build of Galera) to MySQL 5.6. 

Offline Upgrade

An offline upgrade requires downtime, but it is more straightforward. If you can afford a maintenance window, this is probably a safer way to reduce the risk of upgrade failures. The major steps consists of stopping the cluster, upgrading all nodes, bootstrap and starting the nodes. We covered the procedure in details in this blog post.

Online Upgrade

An online upgrade has to be done in rolling upgrade/restart fashion, i.e., upgrade one node at a time and then proceed to the next. During the upgrade, you will have a mix of MySQL 5.5. and 5.6. This can cause problems if not handled with care. 

Here is the list that you need to check prior to the upgrade:

  • Read and understand the changes with the new version
  • Note the unsupported configuration options between the major versions
  • Determine your cluster ID from the ClusterControl summary bar
  • garbd nodes will also need to be upgraded
  • All nodes must have internet connection
  • SST must be avoided in the duration of upgrade so we must ensure each node’s gcache is appropriately configured and must be loaded prior to the upgrade.
  • Some nodes will be read-only during the period of upgrade which means there will be some impact on the cluster’s write performance. Perform the upgrade during non-peak hours.
  • The load balancer must be able to detect and exclude backend DB servers in read-only mode. Writes come from 5.6 are not compatible with 5.5 in a same cluster. Percona’s clustercheck and ClusterControl mysqlchk script should be able to handle this by default.
  • If you are running on ClusterControl, ensure ClusterControl auto recovery feature is turned off to prevent ClusterControl recovering a node during its upgrade. 

Here is what we’re going to do to perform the online upgrade:

  1. Set up Codership repository on all DB nodes.
  2. Increase gcache size and perform rolling restart.
  3. Backup all databases.
  4. Turn off ClusterControl auto recovery.
  5. Start the maintenance window.
  6. Upgrade packages in Db1 to 5.6.
  7. Add compatibility configuration options on my.cnf of Db1 (node will be read-only).
  8. Start Db1. At this point the cluster will consist MySQL 5.5 and 5.6 nodes. (Db1 is read-only, writes go to Db2 and Db3)
  9. Upgrade packages in Db2 to 5.6.
  10. Add compatibility configuration options on my.cnf of Db2 (node will be read-only).
  11. Start Db2. (Db1 and Db2 are read-only, writes go to Db3)
  12. Bring down Db3 so the read-only on upgraded nodes can be turned off (no more MySQL 5.5 at this point)
  13. Turn off read-only on Db1 and Db2. (Writes go to Db1 and Db2)
  14. Upgrade packages in Db3 to 5.6.
  15. Start Db3. At this point the cluster will consist of MySQL 5.6 nodes. (Writes go to Db1, Db2 and Db3)
  16. Clean up the compatibility options on all DB nodes.
  17. Verify nodes performance and availability.
  18. Turn on ClusterControl auto recovery.
  19. Close maintenance window

Upgrade Steps

In this example, we have three nodes MySQL Galera Cluster 5.5 (Codership) that we installed via the Severalnines Configurator running on CentOS 6 and Ubuntu 14.04. The steps performed here should work regardless if the cluster is deployed with or without ClusterControl. Omit sudo if you are running as root.

Preparation

1. MySQL 5.6 packages are available in the Codership package repository. We need to enable the repository on each of the DB nodes. You can find instructions for other operating systems here.

On CentOS 6, add the following lines into /etc/yum.repos.d/Codership.repo:

[codership]
name = Galera
baseurl = http://releases.galeracluster.com/centos/6/x86_64
gpgkey = http://releases.galeracluster.com/GPG-KEY-galeracluster.com
gpgcheck = 1

On Ubuntu 14.04:

$ sudo apt-key adv --keyserver keyserver.ubuntu.com --recv BC19DDBA
$ echo "deb http://releases.galeracluster.com/ubuntu trusty main" | sudo tee -a /etc/apt/sources.list
$ sudo apt-get update

2. Increase gcache size to a suitable amount. To be safe, increase the size so it can hold up to 1 to 2 hours downtime, as explained in this blog post under 'Determining good gcache size’'section. In this example, we are going to increase the gcache size to 1GB. Open MySQL configuration file:

$ vim /etc/my.cnf # CentOS
$ sudo vim /etc/mysql/my.cnf # Ubuntu

Append or modify the following line under wsrep_provider_options:

wsrep_provider_options="gcache.size=1G"

Perform a rolling restart to apply the change. For ClusterControl users, you can use Manage > Upgrades > Rolling Restart.

3. Backup all databases. This is critical before performing any upgrade so you have something to fail back to if the upgrade fails. For ClusterControl users, you can use Backup > Start a Backup Immediately.

4. Turn off ClusterControl auto recovery from the UI, similar to screenshot below:

5. If you installed HAProxy through ClusterControl, there was a bug in previous versions in the health check script when detecting read-only node. Run the following command on all DB nodes to fix it (this is fixed in the latest version):

$ sudo sed -i 's/YES/ON/g' /usr/local/sbin/mysqlchk

Upgrading Database Server Db1 and Db2

1. Stop the MySQL service and remove the existing package. For Ubuntu/Debian, remove the symlink to MySQL 5.5 base directory which should be installed under /usr/local/mysql:

CentOS:

$ service mysql stop
$ yum remove MySQL-*

Ubuntu:

$ sudo service mysql stop
$ sudo rm -f /usr/local/mysql

IMPORTANT: As time is critical to avoid SST (in this post our gcache size can hold up to ~1 hour downtime without SST), you can download the packages directly from the repository before bringing down MySQL and then use local install command (yum localinstall or dpkg -i) instead to speed up the installation process. We have seen cases where the MySQL installation via package manager took a very long time due to slow connection to Codership’s repository.

2. Modify the MySQL configuration file for 5.6’s non-compatible option by commenting or removing the following line (if exists):

#engine-condition-pushdown=1

Then, append and modify the following lines for backward compatibility options:

[MYSQLD]
# new basedir installed with apt (Ubuntu/Debian only)
basedir=/usr

# Required for compatibility with galera-2
# Append socket.checksum=1 in wsrep_provider_options:
wsrep_provider_options="gcache.size=1G; socket.checksum=1"

# Required for replication compatibility
# Add following lines under [mysqld] directive:
log_bin_use_v1_row_events=1
binlog_checksum=NONE
gtid_mode=0
read_only=ON

[MYSQLD_SAFE]
# new basedir installed with apt (Ubuntu/Debian only)
basedir=/usr

3. Once configured, install the latest version via package manager:
CentOS:

$ yum install mysql-wsrep-server-5.6 mysql-wsrep-client-5.6

Ubuntu (also need to change the mysql client path in mysqlchk script):

$ sudo apt-get install mysql-wsrep-5.6
$ sudo sed -i 's|MYSQL_BIN=.*|MYSQL_BIN="/usr/bin/mysql"|g' /usr/local/sbin/mysqlchk

4. Start MySQL with skip grant and run mysql_upgrade script to upgrade system table:

$ sudo mysqld --skip-grant-tables --user=mysql --wsrep-provider='none'&
$ sudo mysql_upgrade -uroot -p

Make sure the last line returns ‘OK’, indicating the mysql_upgrade succeeded.

5. Gracefully kill the running mysqld process and start the server:

$ sudo killall -15 mysqld
$ sudo service mysql start

Monitor the MySQL error log and ensure the node joins through IST, similar to below:

2015-08-14 16:56:12 89049 [Note] WSREP: Signalling provider to continue.
2015-08-14 16:56:12 89049 [Note] WSREP: inited wsrep sidno 1
2015-08-14 16:56:12 89049 [Note] WSREP: SST received: 82f872f9-4188-11e5-aa6b-2ab795bec872:46229
2015-08-14 16:56:12 89049 [Note] WSREP: Receiving IST: 49699 writesets, seqnos 46229-95928
2015-08-14 16:56:12 89049 [Note] /usr/sbin/mysqld: ready for connections.
Version: '5.6.23'  socket: '/var/lib/mysql/mysql.sock'  port: 3306  MySQL Community Server (GPL), wsrep_25.10
2015-08-14 16:56:20 89049 [Note] WSREP: 0 (192.168.55.139): State transfer to 1 (192.168.55.140) complete.
2015-08-14 16:56:20 89049 [Note] WSREP: IST received: 82f872f9-4188-11e5-aa6b-2ab795bec872:95928
2015-08-14 16:56:20 89049 [Note] WSREP: Member 0 (192.168.55.139) synced with group.
2015-08-14 16:56:20 89049 [Note] WSREP: 1 (192.168.55.140): State transfer from 0 (192.168.55.139) complete.
2015-08-14 16:56:20 89049 [Note] WSREP: Shifting JOINER -> JOINED (TO: 97760)
2015-08-14 16:56:20 89049 [Note] WSREP: Member 1 (192.168.55.140) synced with group.
2015-08-14 16:56:20 89049 [Note] WSREP: Shifting JOINED -> SYNCED (TO: 97815)
2015-08-14 16:56:20 89049 [Note] WSREP: Synchronized with group, ready for connections

Repeat the same step for the second node. Once upgrade is completed on Db1 and Db2, you should notice that writes are now redirected to Db3, which is still running on MySQL 5.5:

This doesn’t mean that both upgraded MySQL servers are down, they are just set to be read-only to prevent writes coming from 5.6 being replicated to 5.5 (which is not supported). We will switch the writes over just before we start the upgrade of the last node.

Upgrading the Last Database Server (Db3)

1. Stop MySQL service on Db3:

$ sudo service mysql stop

2. Turn off read-only on Db1 and Db2 so they can start to receive writes. From this point, writes will go to MySQL 5.6 only. On Db1 and Db2, run the following statement:

$ mysql -uroot -p -e 'SET GLOBAL read_only = OFF'

Verify that you see something like below on the HAProxy statistic page (ClusterControl > Nodes > select HAproxy node), indicating Db1 and Db2 are now up and active:

4. Modify the MySQL configuration file for 5.6’s non-compatible option by commenting or removing the following line (if exists):

#engine-condition-pushdown=1

Then, modify the following lines for the new basedir path (Ubuntu/Debian only):

[MYSQLD]
# new basedir installed with apt (Ubuntu/Debian only)
basedir=/usr

[MYSQLD_SAFE]
# new basedir installed with apt (Ubuntu/Debian only)
basedir=/usr

** There is no need to enable backward compatibility options anymore since the other nodes (Db1 and Db2) are already in 5.6.

3. Now we can proceed with the upgrade on Db3:

CentOS:

$ yum remove MySQL-*
$ yum install mysql-wsrep-server-5.6 mysql-wsrep-client-5.6

Ubuntu (also need to change the mysql client path in mysqlchk script):

$ sudo rm -f /usr/local/mysql
$ sudo apt-get install mysql-wsrep-5.6
$ sudo sed -i 's|MYSQL_BIN=.*|MYSQL_BIN="/usr/bin/mysql"|g' /usr/local/sbin/mysqlchk

5. Start MySQL with skip grant and run mysql_upgrade script to upgrade system tables:

$ sudo mysqld --skip-grant-tables --user=mysql --wsrep-provider='none'&
$ sudo mysql_upgrade -uroot -p

Make sure the last line returns ‘OK’, indicating the mysql_upgrade succeeded.

6. Gracefully kill the running mysqld process and start the server:

$ sudo killall -15 mysqld
$ sudo service mysql start

Wait until the last node joins the cluster and verify the status and version from the ClusterControl Overview tab:

That’s it. Your cluster is upgraded to 5.6. Next, we need to perform some cleanups.

Cleaning Up

1. Fetch the new configuration file contents into ClusterControl by going to ClusterControl > Manage > Configurations > Reimport Configuration.

2. Remove the backward compatibility option on Db1 and Db2 by modifying the following lines:

# Remove socket.checksum=1 in wsrep_provider_options:
wsrep_provider_options="gcache.size=1G"

# Remove or comment following lines:
#log_bin_use_v1_row_events=1
#gtid_mode=0
#binlog_checksum=NONE
#read_only=ON

Restart Db1 and Db2 (one node at a time) to immediately apply the changes.

3. Enable ClusterControl automatic recovery:

4. In some occasions, you might see “undefined()” appearing in Overview page. This is due to a ClusterControl bug in previous versions on detecting a new node. To reset the node status, perform the following command on ClusterControl node:

$ sudo service cmon stop
$ mysql -uroot -p -e 'truncate cmon.server_node'
$ sudo service cmon start

Take note that the upgrade preparation part could take a long time if you have a huge dataset to backup. The upgrading process (excluding preparation) took us approximately 45 minutes to complete. For MariaDB users, we will cover online upgrade to MariaDB Cluster 10 in an upcoming post. Stay tuned!

References

Blog category:

Howto: Online Upgrade of MariaDB Galera Cluster 5.5 to MariaDB 10

$
0
0

The MariaDB team released a GA version of MariaDB Galera Cluster 10 in June 2014. MariaDB 10 is the equivalent of MySQL 5.6, and therefore, packed with lots of great features. 

In this blog post, we’ll look into how to perform an online upgrade to MariaDB Galera Cluster 10. At the time of writing, MariaDB 10.1 was still in beta so the instructions in this blog are applicable to MariaDB 10.0. If you are running the Codership build of Galera (Galera Cluster for MySQL), you might be interested in the online upgrade to MySQL 5.6 instead. 

Offline Upgrade

An offline upgrade requires downtime, but it is more straightforward. If you can afford a maintenance window, this is probably a safer way to reduce the risk of upgrade failures. The major steps consists of stopping the cluster, upgrading all nodes, bootstrap and starting the nodes. We covered the procedure in details in this blog post.

Online Upgrade

An online upgrade has to be done in rolling upgrade/restart fashion, i.e., upgrade one node at a time and then proceed to the next. During the upgrade, you will have a mix of MariaDB 5.5. and 10. This can cause problems if not handled with care. 

Here is the list that you need to check prior to the upgrade:

  • Read and understand the changes with the new version
  • Note the unsupported configuration options between the major versions
  • Determine your cluster ID from the ClusterControl summary bar
  • garbd nodes will also need to be upgraded
  • All nodes must have internet connection
  • SST must be avoided during the upgrade so we must ensure each node’s gcache is appropriately configured and loaded prior to the upgrade.
  • Some nodes will be read-only during the period of upgrade which means there will be some impact on the cluster’s write performance. Perform the upgrade during non-peak hours.
  • The load balancer must be able to detect and exclude backend DB servers in read-only mode. Writes coming from MariaDB 10.0 are not compatible with 5.5 in a same cluster. Percona’s clusterchk and ClusterControl mysqlchk script should be able to handle this by default.
  • If you are running on ClusterControl, ensure ClusterControl auto recovery feature is turned off to prevent ClusterControl from recovering a node during its upgrade. 

Here is what we’re going to do to perform the online upgrade:

  1. Set up MariaDB 10 repository on all DB nodes.
  2. Increase gcache size and perform rolling restart.
  3. Backup all databases.
  4. Turn off ClusterControl auto recovery.
  5. Start the maintenance window.
  6. Upgrade packages in Db1 to MariaDB 10.
  7. Add compatibility configuration options on my.cnf of Db1 (node will be read-only).
  8. Start Db1. At this point the cluster will consist of MariaDB 10 and 5.5 nodes. (Db1 is read-only, writes go to Db2 and Db3)
  9. Upgrade packages in Db2 to MariaDB 10.
  10. Add compatibility configuration options on my.cnf of Db2 (node will be read-only).
  11. Start Db2. (Db1 and Db2 are read-only, writes go to Db3)
  12. Bring down Db3 so the read-only on upgraded nodes can be turned off (no more MariaDB 5.5 at this point)
  13. Turn off read-only on Db1 and Db2. (Writes go to Db1 and Db2)
  14. Upgrade packages in Db3 to MariaDB 10.
  15. Start Db3. At this point the cluster will consist of MariaDB 10 nodes. (Writes go to Db1, Db2 and Db3)
  16. Clean up the compatibility options on all DB nodes.
  17. Verify nodes performance and availability.
  18. Turn on ClusterControl auto recovery.
  19. Close maintenance window

Upgrade Steps

In the following example, we have a 3-node MariaDB Galera Cluster 5.5 that we installed via the Severalnines Configurator, running on CentOS 6 and Ubuntu 14.04. The steps performed here should work regardless of the cluster being deployed with or without ClusterControl. Omit sudo if you are running as root.

Preparation

1. MariaDB 10 packages are available in the MariaDB package repository. Replace the existing MariaDB repository URL with version 10.

On CentOS 6:

$ sed -i 's/5.5/10.0/' /etc/yum.repos.d/MariaDB.repo

On Ubuntu 14.04:

$ sudo sed -i 's/5.5/10.0/' /etc/apt/sources.list.d/MariaDB.list

2. Increase gcache size to a suitable amount. To be safe, increase the size so it can hold up to 1 to 2 hours downtime, as explained in this blog post under ‘Determining good gcache size’ section. In this example, we are going to increase the gcache size to 1GB. Open the MariaDB configuration file:

$ vim /etc/my.cnf # CentOS
$ sudo vim /etc/mysql/my.cnf # Ubuntu

Append or modify the following line under wsrep_provider_options:

wsrep_provider_options="gcache.size=1G"

Perform a rolling restart to apply the change. For ClusterControl users, you can use Manage > Upgrades > Rolling Restart.

3. Backup all databases. This is critical before performing any upgrade so you have something to fall back to if the upgrade fails. For ClusterControl users, you can use Backup > Start a Backup Immediately.

4. Turn off ClusterControl auto recovery from the UI, similar to screenshot below:

5. If you installed HAProxy through ClusterControl, there was a bug in previous versions in the health check script when detecting read-only node. Run the following command on all DB nodes to fix it (this is fixed in the latest version):

$ sudo sed -i 's/YES/ON/g' /usr/local/sbin/mysqlchk


Upgrading Database Server Db1 and Db2

1. Stop the MariaDB service and remove MariaDB Galera server and galera package.

CentOS:

$ service mysql stop
$ yum remove MariaDB*server MariaDB-client galera

Ubuntu:

$ sudo killall -15 mysqld mysqld_safe
$ sudo apt-get remove mariadb-galera* galera*

2. Modify the MariaDB configuration file for 10’s non-compatible option by commenting or removing the following line (if exists):

#engine-condition-pushdown=1

Then, append and modify the following lines for backward compatibility options:

[MYSQLD]
# Required for compatibility with galera-2. Ignore if you have galera-3 installed.
# Append socket.checksum=1 in wsrep_provider_options:
wsrep_provider_options="gcache.size=1G; socket.checksum=1"

# Required for replication compatibility
# Add following lines under [mysqld] directive:
binlog_checksum=NONE
read_only=ON

3. For CentOS, install the latest version via package manager and follow the substeps (a) and (b):
CentOS:

$ yum clean metadata
$ yum install MariaDB-Galera-server MariaDB-client MariaDB-common MariaDB-compat galera

3a) Start MariaDB with skip grant and run mysql_upgrade script to upgrade system table:

$ mysqld --skip-grant-tables --user=mysql --wsrep-provider='none'&
$ mysql_upgrade -uroot -p

Make sure the last line returns ‘OK’, indicating the mysql_upgrade succeeded.

3b) Gracefully kill the running mysqld process and start the server:

$ sudo killall -15 mysqld
$ sudo service mysql start

Ubuntu:

$ sudo apt-get update
$ sudo apt-get install mariadb-galera-server

**For Ubuntu and Debian packages, mysql_upgrade will be run automatically when they are installed.

4. Monitor the MariaDB error log and ensure the node joins through IST, similar to below:

150821 15:08:04 [Note] WSREP: Signalling provider to continue.
150821 15:08:04 [Note] WSREP: SST received: 2d14e556-473a-11e5-a56e-27822412a930:517325
150821 15:08:04 [Note] WSREP: Receiving IST: 1711 writesets, seqnos 517325-519036
150821 15:08:04 [Note] /usr/sbin/mysqld: ready for connections.
Version: '10.0.21-MariaDB-wsrep'  socket: '/var/lib/mysql/mysql.sock'  port: 3306  MariaDB Server, wsrep_25.10.r4144
150821 15:08:04 [Note] WSREP: IST received: 2d14e556-473a-11e5-a56e-27822412a930:519036
150821 15:08:04 [Note] WSREP: 0.0 (192.168.55.139): State transfer from 2.0 (192.168.55.141) complete.
150821 15:08:04 [Note] WSREP: Shifting JOINER -> JOINED (TO: 519255)
150821 15:08:04 [Note] WSREP: Member 0.0 (192.168.55.139) synced with group.
150821 15:08:04 [Note] WSREP: Shifting JOINED -> SYNCED (TO: 519260)
150821 15:08:04 [Note] WSREP: Synchronized with group, ready for connections

Repeat the same step for the second node. Once the upgrade is completed on Db1 and Db2, you should notice that writes are now redirected to Db3, which is still running on MariaDB 5.5:

This doesn’t mean that both upgraded MariaDB servers are down, they are just set to be read-only to prevent writes coming from 10 being replicated to 5.5 (which is not supported). We will switch the writes over just before we start the upgrade of the last node.

Upgrading the Last Database Server (Db3)

1. Stop MariaDB service on Db3:

$ sudo service mysql stop # CentOS
$ sudo killall -15 mysqld mysqld_safe # Ubuntu

2. Turn off read-only on Db1 and Db2 so they can start to receive writes. From this point, writes will go to MariaDB 10 only. On Db1 and Db2, run the following statement:

$ mysql -uroot -p -e 'SET GLOBAL read_only = OFF'

Verify that you see something like below on the HAProxy statistic page (ClusterControl > Nodes > select HAproxy node), indicating Db1 and Db2 are now up and active:

3. Modify the MariaDB configuration file for 10’s non-compatible option by commenting or removing the following line (if exists):

#engine-condition-pushdown=1

** There is no need to enable backward compatibility options anymore since the other nodes (Db1 and Db2) are already in 10.

4. Now we can proceed with the upgrade on Db3. Install the latest version via package manager. For CentOS, follow the substeps (a) and (b):
CentOS:

$ yum clean metadata
$ yum install MariaDB-Galera-server MariaDB-client MariaDB-common MariaDB-compat galera

4a) Start MariaDB with skip grant and run mysql_upgrade script to upgrade system table:

$ mysqld --skip-grant-tables --user=mysql --wsrep-provider='none'&
$ mysql_upgrade -uroot -p

Make sure the last line returns ‘OK’, indicating the mysql_upgrade succeeded.

4b) Gracefully kill the running mysqld process and start the server:

$ sudo killall -15 mysqld
$ sudo service mysql start

Ubuntu:

$ sudo apt-get update
$ sudo apt-get install mariadb-galera-server

**For Ubuntu and Debian packages, mysql_upgrade will be run automatically when they are installed.

Wait until the last node joins the cluster and verify the status and version from the ClusterControl Overview tab:

That’s it. Your cluster is upgraded to MariaDB Galera 10. Next, we need to perform some cleanups.

Cleaning Up

1. Fetch the new configuration file contents into ClusterControl by going to ClusterControl > Manage > Configurations > Reimport Configuration.

2. Remove the backward compatibility option on Db1 and Db2 by modifying the following lines:

# Remove socket.checksum=1 in wsrep_provider_options:
wsrep_provider_options="gcache.size=1G"

# Remove or comment following lines:
#binlog_checksum=NONE
#read_only=ON

Restart Db1 and Db2 (one node at a time) to immediately apply the changes.

3. Enable ClusterControl automatic recovery:

4. In some occasions, you might see “undefined()” appearing in Overview page. This is due to a ClusterControl bug in previous versions on detecting a new node. To reset the node status, run the following on the ClusterControl node:

$ sudo service cmon stop
$ mysql -uroot -p -e 'truncate cmon.server_node'
$ sudo service cmon start

Take note that the upgrade preparation part could take a long time if you have a huge dataset to backup. The upgrading process (excluding preparation) took us approximately 45 minutes to complete. 

For MySQL Galera users, we have covered the similar online upgrade to MySQL 5.6 in this blog post.

References

Blog category:

Become a MySQL DBA blog series - Analyzing your SQL Workload using pt-query-digest

$
0
0

In our previous post, we discussed the different ways to collect data about slow queries - MySQL offers slow log, general log and binary log. Using tcpdump, you can grab network traffic data - a good and low-impact method of collecting basic metrics for slow queries. So, now that you are sitting on top of a large pile of data, perhaps tens of gigabytes of logs, how do you get a whole picture of the workload? 

Mid to large size applications tend to have hundred of SQL statements distributed throughout a large code base, with potentially hundreds of queries running every second. That can generate a lot of data. How do we identify causes of bottlenecks slowing down our applications? Obviously, going through the information query by query would not be great - we’ll get drowned with all the entries. We need to find a way to aggregate the data and make sense of all that.

One solution would be to write your own scripts to parse the logs and generate some sensible output. But why reinvent the wheel when such a script already exists, and is only a single wget away? In this blog, we’ll have a close look at pt-query-digest, which is part of Percona Toolkit. 

This is the tenth installment in the ‘Become a MySQL DBA’ blog series. Our previous posts in the DBA series include Query Tuning Process, Configuration Tuning,  Live Migration using MySQL Replication, Database Upgrades, Replication Topology Changes, Schema Changes, High Availability, Backup & Restore, Monitoring & Trending.

Processing data

Pt-query-digest accepts data from general log, binary log, slow log or tcpdump - this covers all of the ways MySQL can generate query data. In addition to that, it’s possible to poll the MySQL process list at a defined interval - a process which can be resource-intensive and far from ideal, but can still be used as a an alternative.

Let’s start with data collected in the slow log. For completeness we’ve used Percona Server with log_slow_verbosity=full. As a source of queries we’ve used sysbench started with --oltp-read-only=off and default query mix.

Slow log - summary part

First of all, we need to process all the data in our slow query log. This can be done by running:

$ pt-query-digest --limit=100% /var/lib/mysql/slow.log > ptqd1.out

We’ve used limit=100% to ensure all queries are included in the report, otherwise some of the less impacting queries may not end up in the output.

After a while you’ll be presented with a report file. It starts with a summary section.

# 52.5s user time, 100ms system time, 33.00M rss, 87.85M vsz
# Current date: Sat Aug 22 16:56:34 2015
# Hostname: vagrant-ubuntu-trusty-64
# Files: /var/lib/mysql/slow.log
# Overall: 187.88k total, 11 unique, 3.30k QPS, 0.73x concurrency ________
# Time range: 2015-08-22 16:54:17 to 16:55:14

At the beginning, you’ll see information about how many queries were logged, how many unique query types there were, QPS and what the concurrency looked like. You can also check the timeframe for the report.

To calculate unique queries, pt-query-digest strips down values passed in the WHERE condition, removes all whitespaces (among others) and calculates a hash for a query. Such hash, called a ‘Query ID’ is used in pt-query-digest to differentiate between queries.

# Attribute          total     min     max     avg     95%  stddev  median
# ============     ======= ======= ======= ======= ======= ======= =======
# Exec time            42s     3us    66ms   221us   541us   576us   131us
# Lock time             5s       0    25ms    26us    38us   146us    21us
# Rows sent          2.78M       0     100   15.54   97.36   34.53    0.99
# Rows examine       6.38M       0     300   35.63  192.76   77.79    0.99
# Rows affecte      36.66k       0       1    0.20    0.99    0.40       0
# Bytes sent       354.43M      11  12.18k   1.93k  11.91k   4.21k  192.76
# Merge passes           0       0       0       0       0       0       0
# Tmp tables         9.17k       0       1    0.05       0    0.22       0
# Tmp disk tbl           0       0       0       0       0       0       0
# Tmp tbl size       1.11G       0 124.12k   6.20k       0  26.98k       0
# Query size        10.02M       5     245   55.95  151.03   50.65   36.69
# InnoDB:
# IO r bytes        22.53M       0  96.00k  139.75       0   1.73k       0
# IO r ops           1.41k       0       6    0.01       0    0.11       0
# IO r wait             2s       0    38ms    10us       0   382us       0
# pages distin     355.29k       0      17    2.15    4.96    2.13    1.96
# queue wait             0       0       0       0       0       0       0
# rec lock wai         2ms       0   646us       0       0     2us       0
# Boolean:
# Filesort       9% yes,  90% no
# Tmp table      4% yes,  95% no

Another part of the summary is pretty self-explanatory. This is a list of different attributes like execution time, lock time, number of rows sent, examined or modified. There’s also information about temporary tables, query size and network traffic. We also have some InnoDB metrics.

For each of those metrics you can find different statistical data. What was the total execution time (or how many rows in total were examined)? What was the minimal execution time (or minimal number of rows examined)? What was the longest query (or the most rows examined by a single query)? We have also calculated average, 95th percentile, standard deviation and median. Finally, at the end of this section you can find some information about how large percentage of queries created a temporary table or used a filesort algorithm.

Next section tells us more about each of the query type. By default pt-query-digest sorts the queries by total execution time. It can be changed, though (using --order-by flag), and you can easily sort queries by, for example, total number of rows examined.

# Profile
# Rank Query ID           Response time Calls R/Call V/M   Item
# ==== ================== ============= ===== ====== ===== ==============
#    1 0x558CAEF5F387E929 14.6729 35.2% 93956 0.0002  0.00 SELECT sbtest?
#    2 0x737F39F04B198EF6  6.4087 15.4%  9388 0.0007  0.00 SELECT sbtest?
#    3 0x84D1DEE77FA8D4C3  3.8566  9.2%  9389 0.0004  0.00 SELECT sbtest?
#    4 0x3821AE1F716D5205  3.2526  7.8%  9390 0.0003  0.00 SELECT sbtest?
#    5 0x813031B8BBC3B329  3.1080  7.5%  9385 0.0003  0.00 COMMIT
#    6 0xD30AD7E3079ABCE7  2.2880  5.5%  9387 0.0002  0.00 UPDATE sbtest?
#    7 0x6EEB1BFDCCF4EBCD  2.2869  5.5%  9389 0.0002  0.00 SELECT sbtest?
#    8 0xE96B374065B13356  1.7520  4.2%  9384 0.0002  0.00 UPDATE sbtest?
#    9 0xEAB8A8A8BEEFF705  1.6490  4.0%  9386 0.0002  0.00 DELETE sbtest?
#   10 0xF1256A27240AEFC7  1.5952  3.8%  9384 0.0002  0.00 INSERT sbtest?
#   11 0x85FFF5AA78E5FF6A  0.8382  2.0%  9438 0.0001  0.00 BEGIN

As you can see, we have eleven queries listed. Each of them has a calculated summary response time and how big part of the total response time it is. We can check how many calls there were in total, what was the mean request time for a query, its variance-to-mean ratio which tells us whether the workload was stable or not. Finally, we see a query in its distilled form.

This concludes the summary part, the rest of the report discusses exact queries in more detail.

Slow log - queries

In this section pt-query-digest prints data about each of the distinct query type it determined. Queries are sorted from the most time-consuming to the least impacting one.

# Query 1: 1.65k QPS, 0.26x concurrency, ID 0x558CAEF5F387E929 at byte 46229
# This item is included in the report because it matches --limit.
# Scores: V/M = 0.00
# Time range: 2015-08-22 16:54:17 to 16:55:14
# Attribute    pct   total     min     max     avg     95%  stddev  median
# ============ === ======= ======= ======= ======= ======= ======= =======
# Count         50   93956
# Exec time     35     15s     9us    66ms   156us   236us   713us   119us
# Lock time     52      3s       0    25ms    27us    33us   199us    20us

From the data above we can learn that this query was responsible for 35% of total execution time. It also consisted 50% of the all queries executed in this slow log. It was responsible for 52% of total row locks. We can check that the query is pretty quick - on average it took 156 microseconds to finish, the longest execution took 66 milliseconds.

# Rows sent      3  91.75k       1       1       1       1       0       1
# Rows examine   1  91.75k       1       1       1       1       0       1
# Rows affecte   0       0       0       0       0       0       0       0
# Bytes sent     4  17.47M     195     195     195     195       0     195
# Merge passes   0       0       0       0       0       0       0       0
# Tmp tables     0       0       0       0       0       0       0       0
# Tmp disk tbl   0       0       0       0       0       0       0       0
# Tmp tbl size   0       0       0       0       0       0       0       0
# Query size    32   3.27M      36      37   36.50   36.69    0.50   36.69

This query sent 3% and examined 1% of rows, which means it’s pretty well optimized when we compare that with total count (it consists 50% of all queries). It’s clearly depicted in the next columns - it scans and sends only a single row which means it is most likely either a PK or an unique key based. No temporary tables were created by this query.

# InnoDB:
# IO r bytes    46  10.42M       0  96.00k  116.31       0   1.37k       0
# IO r ops      46     667       0       6    0.01       0    0.09       0
# IO r wait     68      1s       0    38ms    12us       0   498us       0
# pages distin  14  51.33k       0       8    0.56    3.89    1.33       0
# queue wait     0       0       0       0       0       0       0       0
# rec lock wai   0       0       0       0       0       0       0       0

Next part contains InnoDB statistics. We can see that the query did some disk operations, what’s most important is the fact that it’s responsible for 68% of the InnoDB I/O wait. There are no queue waits (time spent by a thread before it could enter InnoDB kernel) or record lock waits.

# String:
# Databases    sbtest
# Hosts        10.0.0.200
# InnoDB trxID 112C (10/0%), 112D (10/0%), 112E (10/0%)... 9429 more
# Last errno   0
# Users        sbtest
# Query_time distribution
#   1us  #
#  10us  ####
# 100us  ################################################################
#   1ms  #
#  10ms  #
# 100ms
#    1s
#  10s+
# Tables
#    SHOW TABLE STATUS FROM `sbtest` LIKE 'sbtest1'\G
#    SHOW CREATE TABLE `sbtest`.`sbtest1`\G
# EXPLAIN /*!50100 PARTITIONS*/
SELECT c FROM sbtest1 WHERE id=100790\G

Finally, we have some data covering who, where and what. What schema was used for a query? Which host executed the query. Which user executed the query? What InnoDB transaction ID’s it had? Did it end up in error? What was the error number?

We have also a nice chart covering execution time distribution - it’s very useful to locate all those queries which are “fast most of the time but sometimes not really”. These queries may suffer from internal or row level locking issues or have their execution plan flipping. Finally we have SHOW TABLE STATUS and SHOW CREATE TABLE statements printed, covering all of the tables involved in a query. It comes really handy - you can just copy it from the report and paste in the MySQL console - a very nice touch. At the end we can find a full version of the query (along with EXPLAIN, again, for easy copy/paste). Full version represents the query of a given type which had the longest execution time. For a DML, where EXPLAIN doesn’t work yet, pt-query-digest prints the equivalent written in a form of a SELECT:

UPDATE sbtest1 SET k=k+1 WHERE id=100948\G
# Converted for EXPLAIN
# EXPLAIN /*!50100 PARTITIONS*/
select  k=k+1 from sbtest1 where  id=100948\G


Binary log

Another example of data that pt-query-digest can process is the binary log. As we mentioned last time, binary logs contain data regarding DML’s so if you are looking for SELECTs, you won’t find them here. Still, if you are suffering from DML-related issues (significant locking for example), binary logs may be useful to, at least preliminarily, check the health of the database. What’s important is that binary logs have to be in ‘statement’ or ‘mixed’ format to be useful for pt-query-digest. If that’s the case, here are the steps you need to follow to get the report.

First, we need to parse binary logs:

$ mysqlbinlog /var/lib/mysql/binlog.000004 > binlog.000004.txt

Then we need to feed them to pt-query-digest, ensuring that we set --type flag to ‘binlog’:

$ pt-query-digest --type binlog binlog.000004.txt > ptqd_bin.out

Here’s an example output - it’s a bit messy but all data that could have been derived from the binary log is there:

# 7s user time, 40ms system time, 26.02M rss, 80.88M vsz
# Current date: Mon Aug 24 16:43:55 2015
# Hostname: vagrant-ubuntu-trusty-64
# Files: binlog.000004.txt
# Overall: 48.31k total, 9 unique, 710.44 QPS, 0.07x concurrency _________
# Time range: 2015-08-24 12:17:26 to 12:18:34
# Attribute          total     min     max     avg     95%  stddev  median
# ============     ======= ======= ======= ======= ======= ======= =======
# Exec time             5s       0      1s   103us       0    10ms       0
# Query size         4.48M       1     245   81.09  234.30   85.44   38.53
# @@session.au           1       1       1       1       1       0       1
# @@session.ch           8       8       8       8       8       0       8
# @@session.co           8       8       8       8       8       0       8
# @@session.fo           1       1       1       1       1       0       1
# @@session.lc           0       0       0       0       0       0       0
# @@session.ps           2       2       2       2       2       0       2
# @@session.sq           0       0       0       0       0       0       0
# @@session.sq       1.00G   1.00G   1.00G   1.00G   1.00G       0   1.00G
# @@session.un           1       1       1       1       1       0       1
# error code             0       0       0       0       0       0       0


# Query 1: 146.39 QPS, 0.03x concurrency, ID 0xF1256A27240AEFC7 at byte 13260934
# This item is included in the report because it matches --limit.
# Scores: V/M = 0.98
# Time range: 2015-08-24 12:17:28 to 12:18:34
# Attribute    pct   total     min     max     avg     95%  stddev  median
# ============ === ======= ======= ======= ======= ======= ======= =======
# Count         20    9662
# Exec time     40      2s       0      1s   206us       0    14ms       0
# Query size    50   2.25M     243     245  243.99  234.30       0  234.30
# error code     0       0       0       0       0       0       0       0
# String:
# Databases    sbtest
# Query_time distribution
#   1us
#  10us
# 100us
#   1ms
#  10ms
# 100ms
#    1s  ################################################################
#  10s+
# Tables
#    SHOW TABLE STATUS FROM `sbtest` LIKE 'sbtest1'\G
#    SHOW CREATE TABLE `sbtest`.`sbtest1`\G
INSERT INTO sbtest1 (id, k, c, pad) VALUES (99143, 99786, '17998642616-46593331146-44234899131-07942028688-05655233655-90318274520-47286113949-12081567668-14603691757-62610047808', '13891459194-69192073278-13389076319-15715456628-59691839045')\G

As you can see, we have data about number of queries executed and their execution time. There’s also information about query size  and the query itself.

Tcpdump

pt-query-digest works nicely with data captured by tcpdump. We’ve discussed some ways you can collect the data in our last post. One command you may use is:

$ tcpdump -s 65535 -x -nn -q -tttt -i any port 3306 > mysql.tcp.txt

Once the capture process ends, we can proceed with processing the data:

$ pt-query-digest --limit=100% --type tcpdump mysql.tcp.txt > ptqd_tcp.out

Let’s take a look at the final report:

# 113s user time, 3.4s system time, 41.98M rss, 96.71M vsz
# Current date: Mon Aug 24 18:23:20 2015
# Hostname: vagrant-ubuntu-trusty-64
# Files: mysql.tcp.txt
# Overall: 124.42k total, 12 unique, 1.98k QPS, 0.95x concurrency ________
# Time range: 2015-08-24 18:15:58.272774 to 18:17:00.971587
# Attribute          total     min     max     avg     95%  stddev  median
# ============     ======= ======= ======= ======= ======= ======= =======
# Exec time            59s       0   562ms   477us     2ms     3ms   152us
# Rows affecte      24.24k       0       1    0.20    0.99    0.40       0
# Query size         6.64M       5     245   55.97  151.03   50.67   36.69
# Warning coun           0       0       0       0       0       0       0

# Profile
# Rank Query ID           Response time Calls R/Call V/M   Item
# ==== ================== ============= ===== ====== ===== ==============
#    1 0x558CAEF5F387E929 18.1745 30.6% 62212 0.0003  0.01 SELECT sbtest?
#    2 0x813031B8BBC3B329  8.9132 15.0%  6220 0.0014  0.09 COMMIT
#    3 0x737F39F04B198EF6  6.8068 11.4%  6220 0.0011  0.00 SELECT sbtest?
#    4 0xD30AD7E3079ABCE7  5.0876  8.6%  6220 0.0008  0.00 UPDATE sbtest?
#    5 0x84D1DEE77FA8D4C3  3.7781  6.4%  6220 0.0006  0.00 SELECT sbtest?
#    6 0xE96B374065B13356  3.5256  5.9%  6220 0.0006  0.00 UPDATE sbtest?
#    7 0x6EEB1BFDCCF4EBCD  3.4662  5.8%  6220 0.0006  0.00 SELECT sbtest?
#    8 0xEAB8A8A8BEEFF705  2.9711  5.0%  6220 0.0005  0.00 DELETE sbtest?
#    9 0xF1256A27240AEFC7  2.9067  4.9%  6220 0.0005  0.00 INSERT sbtest?
#   10 0x3821AE1F716D5205  2.6769  4.5%  6220 0.0004  0.00 SELECT sbtest?
#   11 0x85FFF5AA78E5FF6A  1.1544  1.9%  6222 0.0002  0.00 BEGIN
#   12 0x5D51E5F01B88B79E  0.0030  0.0%     2 0.0015  0.00 ADMIN CONNECT
# Query 1: 992.25 QPS, 0.29x concurrency, ID 0x558CAEF5F387E929 at byte 293768777
# This item is included in the report because it matches --limit.
# Scores: V/M = 0.01
# Time range: 2015-08-24 18:15:58.273745 to 18:17:00.971587
# Attribute    pct   total     min     max     avg     95%  stddev  median
# ============ === ======= ======= ======= ======= ======= ======= =======
# Count         50   62212
# Exec time     30     18s       0   448ms   292us   657us     2ms   113us
# Rows affecte   0       0       0       0       0       0       0       0
# Query size    32   2.17M      36      37   36.50   36.69    0.50   36.69
# Warning coun   0       0       0       0       0       0       0       0
# String:
# Databases    sbtest^@mysql_native_password
# Hosts        10.0.0.200
# Users        sbtest
# Query_time distribution
#   1us  #
#  10us  ########################
# 100us  ################################################################
#   1ms  ###
#  10ms  #
# 100ms  #
#    1s
#  10s+
# Tables
#    SHOW TABLE STATUS FROM `sbtest^@mysql_native_password` LIKE 'sbtest1'\G
#    SHOW CREATE TABLE `sbtest^@mysql_native_password`.`sbtest1`\G
# EXPLAIN /*!50100 PARTITIONS*/
SELECT c FROM sbtest1 WHERE id=138338\G

It looks fairly similar to the report generated from binary logs. What’s important - resolution is much better. Binary log could show us query execution time rounded to the nearest second, here we enjoy the same resolution as when using slow log with long_query_time=0.

Unfortunately, we are missing every single additional information that slow log could provide - only query count, query execution time and query size is there. Better resolution, though, allows the query execution time graph to be more detailed and therefore it can be used to quickly check if a given query has stable performance or not.

In the previous blog post we mentioned that it’s common to combine different methods of gathering information about queries in the system. We hope you see now why - if you need detailed data, there’s no other way than to use the slow query log. For a day-to-day checks it’s enough to use TCP traffic - it’s less impacting than logging all queries to the slow log, it’s also good enough for determining if a query suffers from slowdowns or not.

In the next post we will walk you through some examples of pt-query-digest reports and how we can derive important information out of them. We will also show you how you can benefit from a different additional options that pt-query-digest offers to get more detailed information.

Blog category:

Viewing all 31 articles
Browse latest View live